
IELTS Academic Writing Task 1Topic
Work
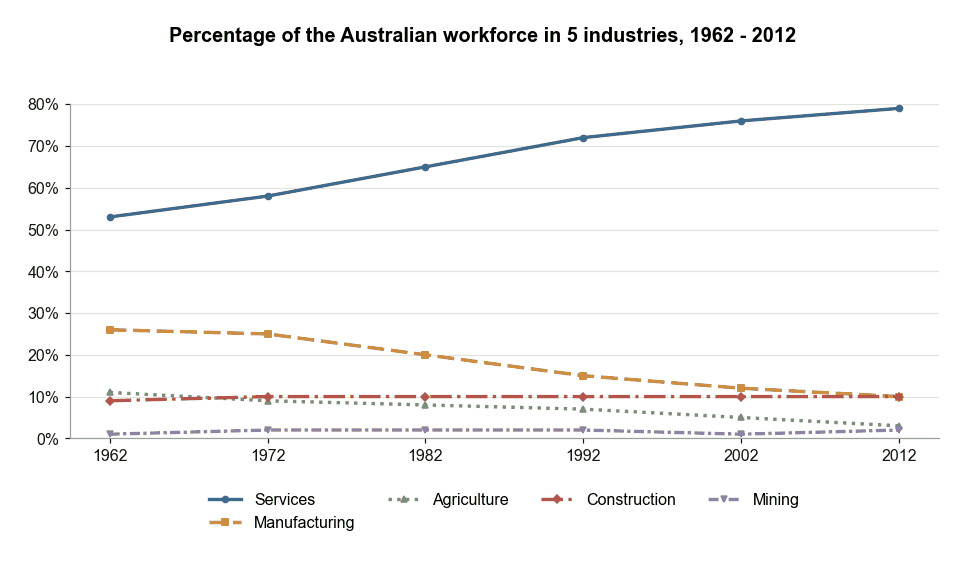
Australian Workforce by Industry 1962-2012
The graph below shows the percentage of the Australian workforce in five industries between 1962 and 2012. Summarise the information by selecting and reporting the main features, and make comparisons where relevant.
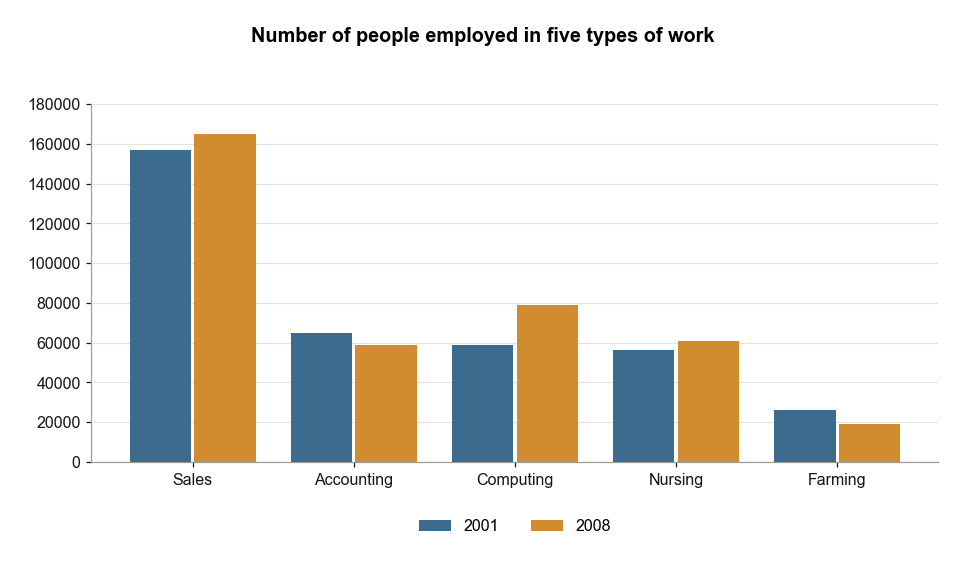
Australian Employment in Five Work Types
The chart below shows the number of people employed in five types of work on one region of Australia in 2001 and 2008. Summarise the information by selecting and reporting the main features, and make comparisons where relevant.
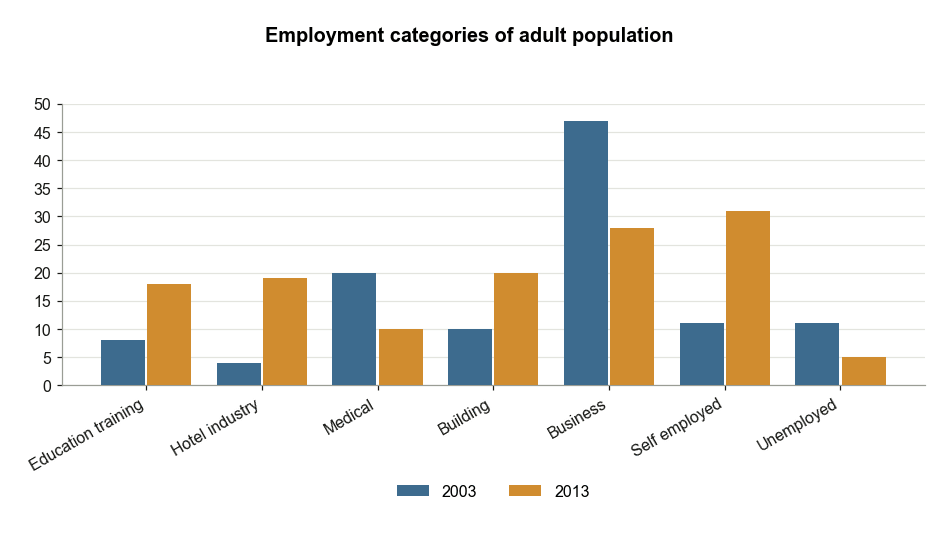
US Adult Employment Status in 2003 and 2013
The chart shows the employment status of adults in the US in 2003 and 2013. Summarise the information by selecting and reporting the main features, and make comparisons where relevant.
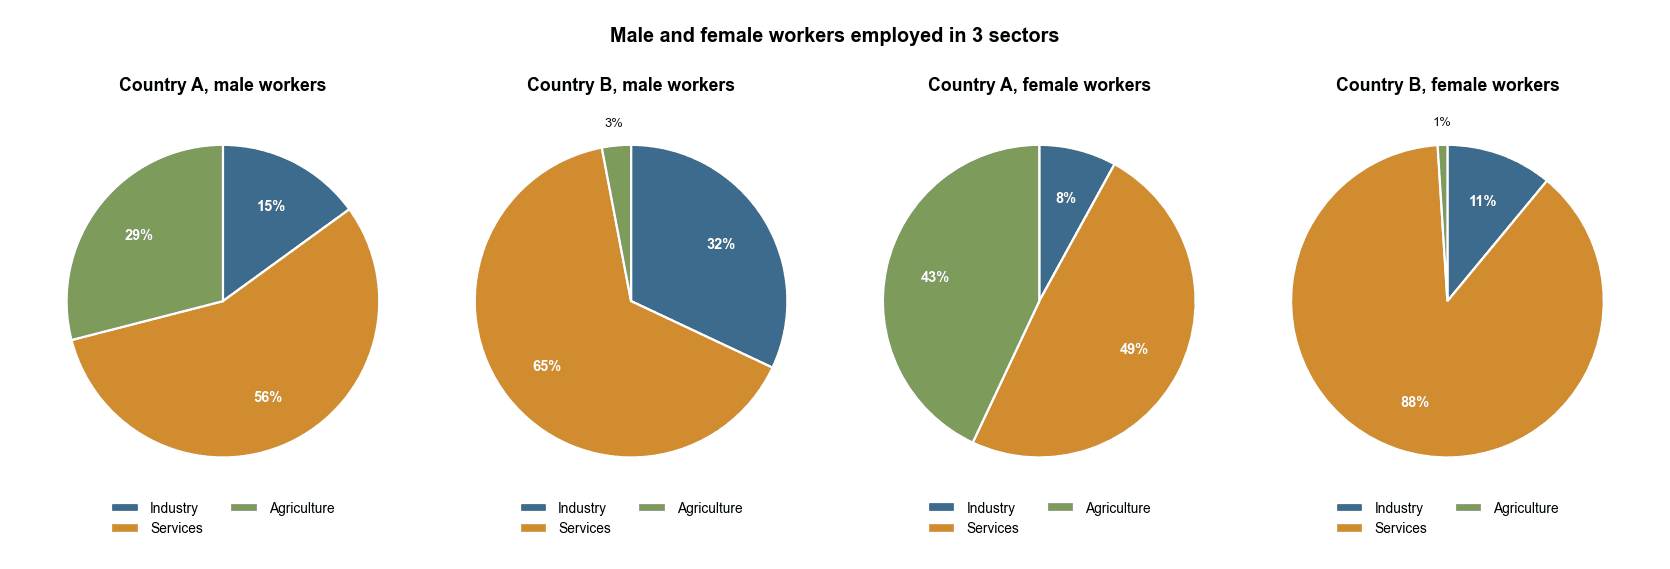
Male and Female Workers Across Sectors in Two Countries
The charts below show the percentage of male and female workers in country A and country B. Summarise the information by selecting and reporting the main features, and make comparisons where relevant.
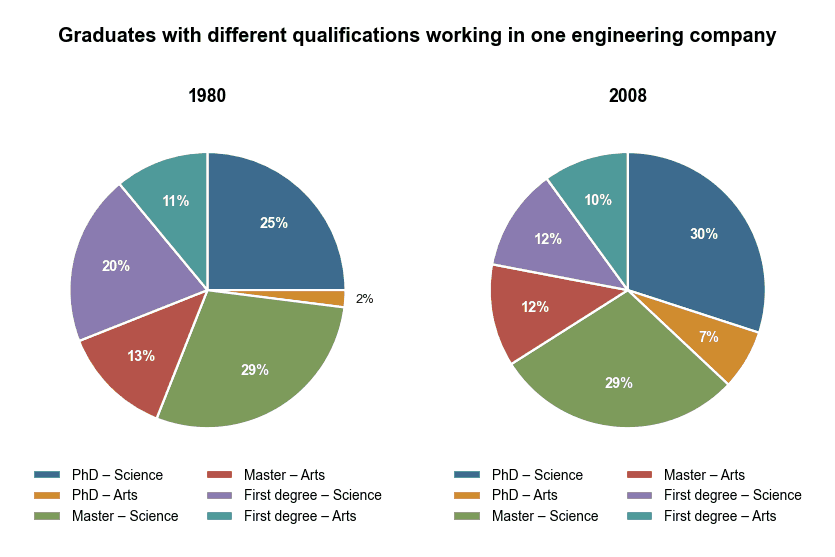
Graduate Qualifications in an Engineering Company
The charts below show the proportion of graduates with different qualifications working in one engineering company in 1980 and 2008. Summarise the information by selecting and reporting the main features, and make comparisons where relevant.
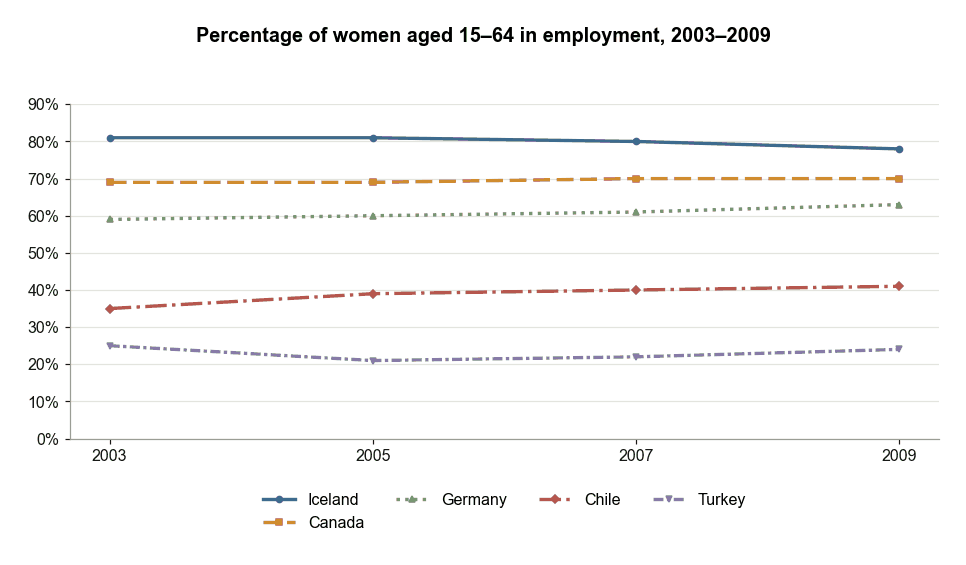
Women in Employment Rates 2003 to 2009
The line graph below gives information about the percentage of women aged 15-64 in employment between 2003 and 2009. Summarise the information by selecting and reporting the main features, and make comparisons where relevant.
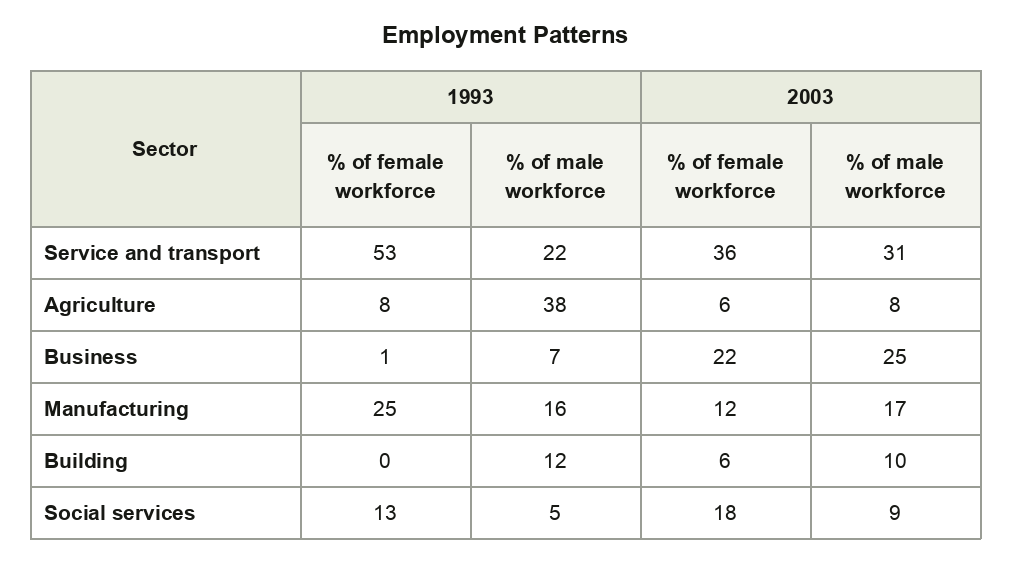
Employment Patterns in New Zealand in 1993 and 2003
The table below shows employment patterns for males and females in New Zealand in 1993 and 2003. Summarise the information by selecting and reporting the main features, and make comparisons where relevant.
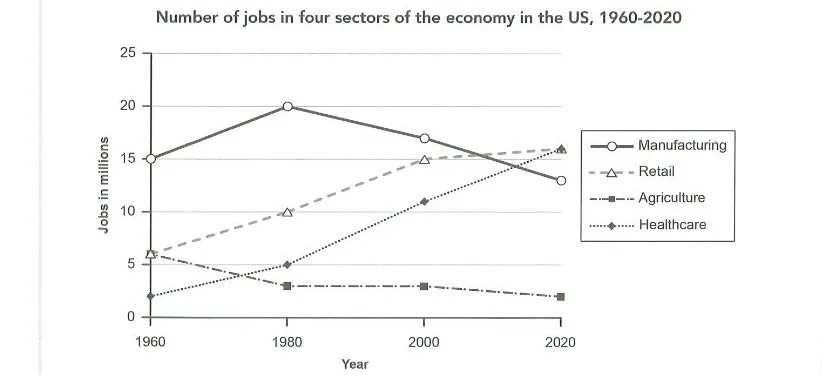
US Jobs in Four Economic Sectors 1960-2020
The graph below gives information about the number of jobs in four sectors of the economy in the US between 1960 and 2020. Summarise the information by selecting and reporting the main features, and make comparisons where relevant.
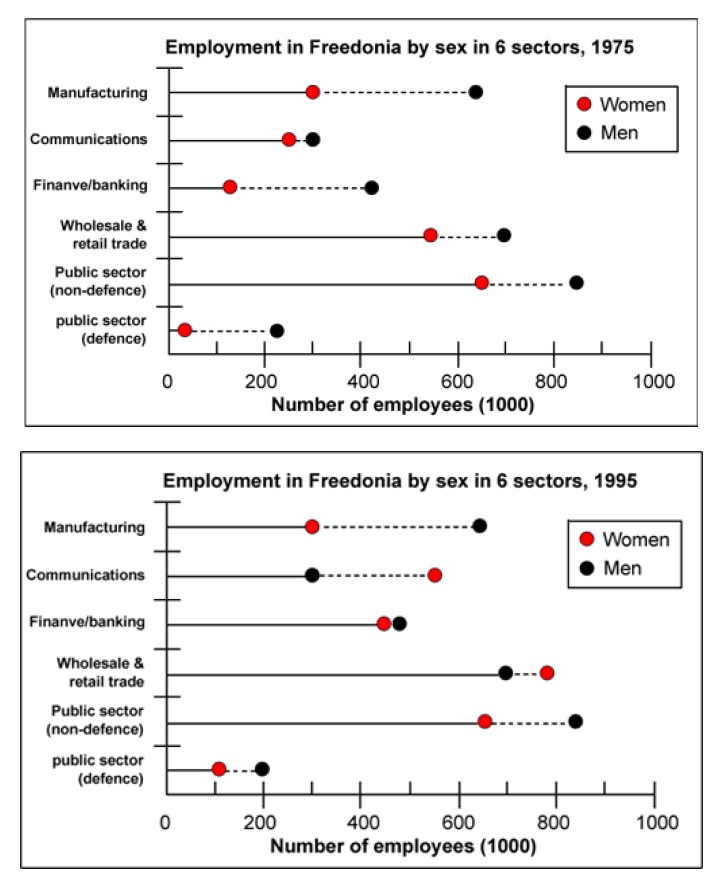
Employment by Gender in Freedonia
The graphs below show the numbers of male and female workers in 1975 and 1995 in several employment sectors of the republic of Freedonia. Write a report for a university teacher describing the information shown.