
IELTS Academic Writing Task 1Topic
Unemployment
Bar chart
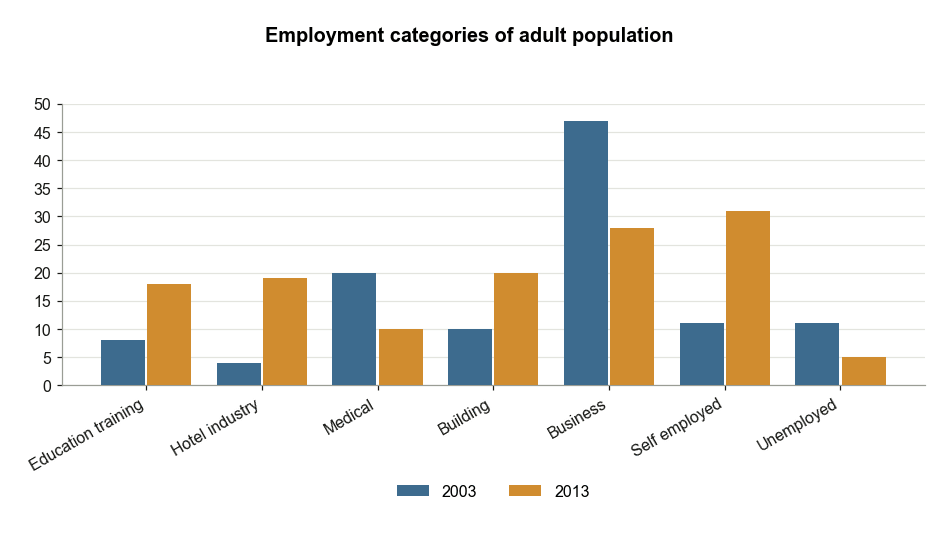
US Adult Employment Status in 2003 and 2013
The chart shows the employment status of adults in the US in 2003 and 2013. Summarise the information by selecting and reporting the main features, and make comparisons where relevant.
Table
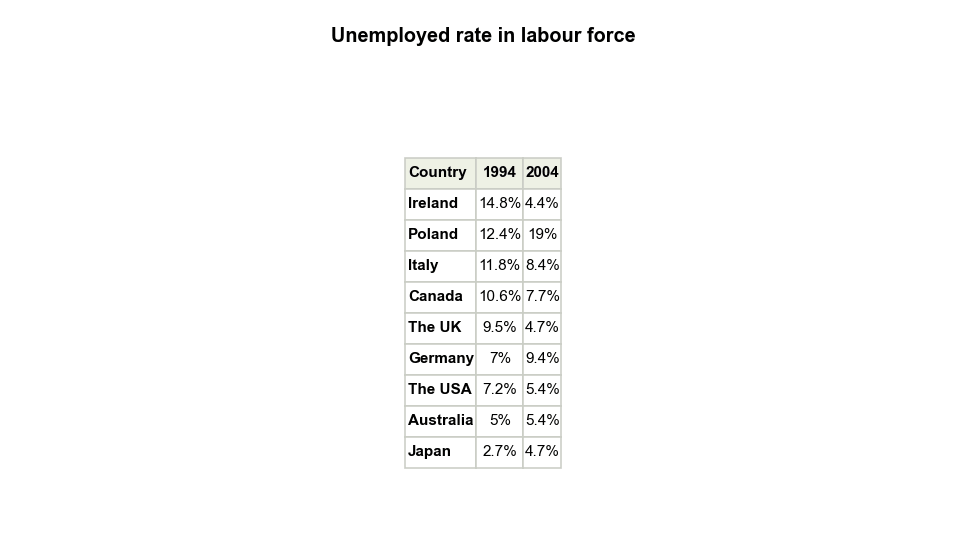
Unemployment Rates in Nine Countries in 1994 and 2004
The graph below shows the percentage of people unemployed in the total labour work force across 9 countries in 1994 and 2004. Summarise the information by selecting and reporting the main features, and make comparisons where relevant.