
IELTS Academic Writing Task 1Topic
Food
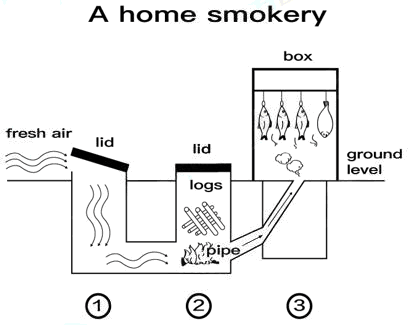
Structure and Operation of a Home Smokery
The diagram below describes the structure of a home smokery and how it works. Summarise the information by selecting and reporting the main features, and make comparisons where relevant.
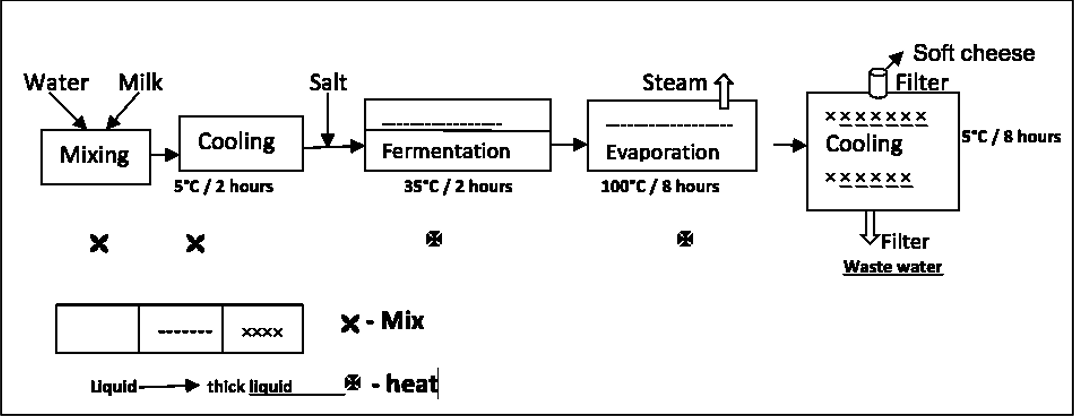
Soft Cheese Production Process
The diagram below shows the process of making soft cheese. Summarise the information by selecting and reporting the main features, and make comparisons where relevant.
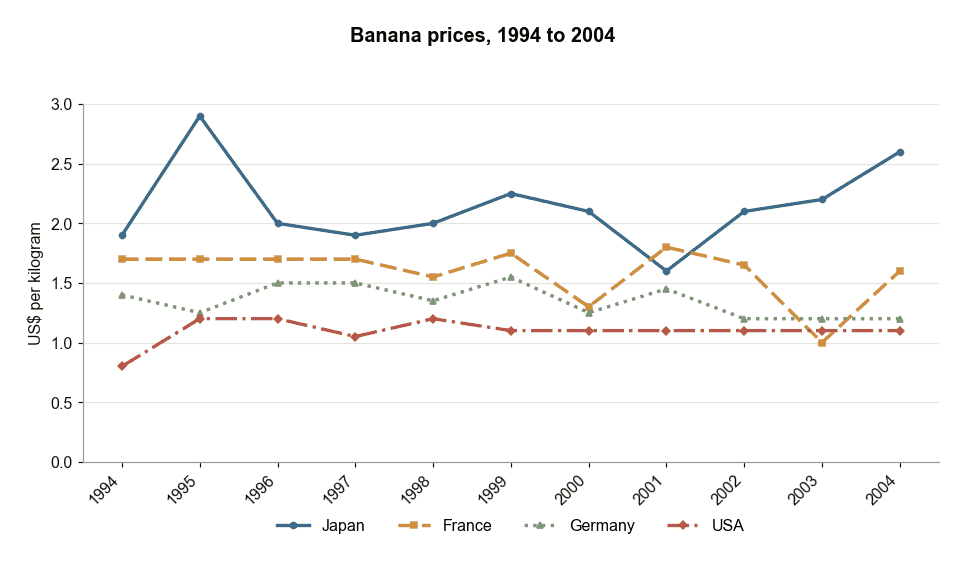
Banana Prices in Four Countries from 1994 to 2004
The graph below gives information about the price of bananas in four countries between 1994 and 2004. Summarise the information by selecting and reporting the main features, and make comparisons where relevant.
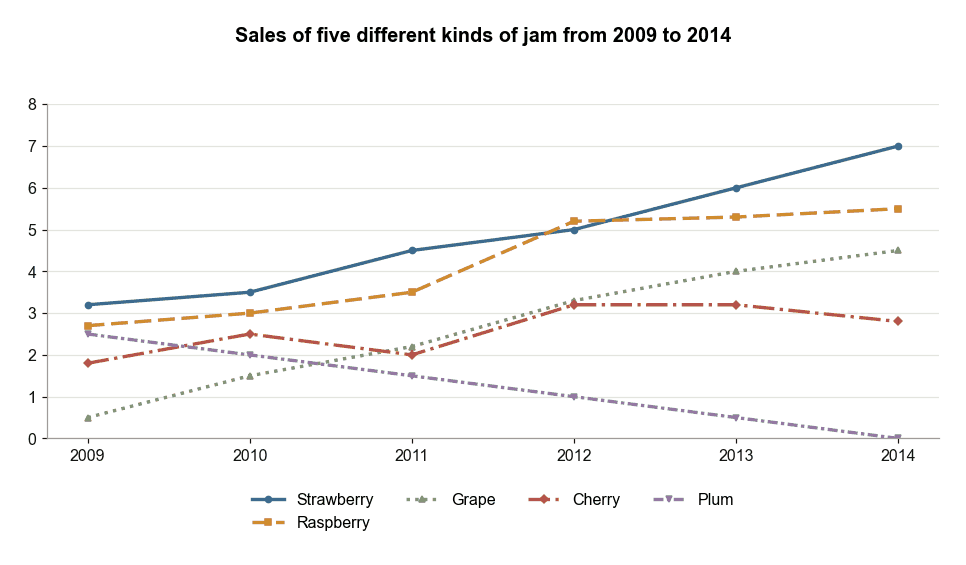
Sales of Five Different Kinds of Jam
The chart shows the sales of five different kinds of jam from 2009 to 2014. Summarise the information by selecting and reporting the main features, and make comparisons where relevant.
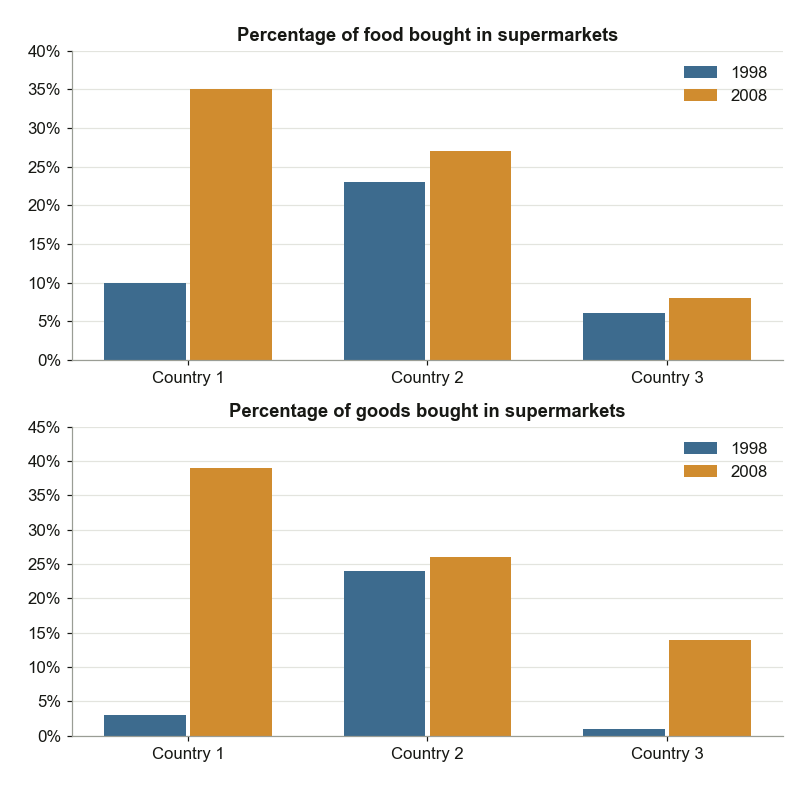
Supermarket Food and Goods Purchases in European Countries
The charts below show the percentages of food and goods bought in supermarkets in European countries in 1998 and 2008. Summarise the information by selecting and reporting the main features, and make comparisons where relevant.
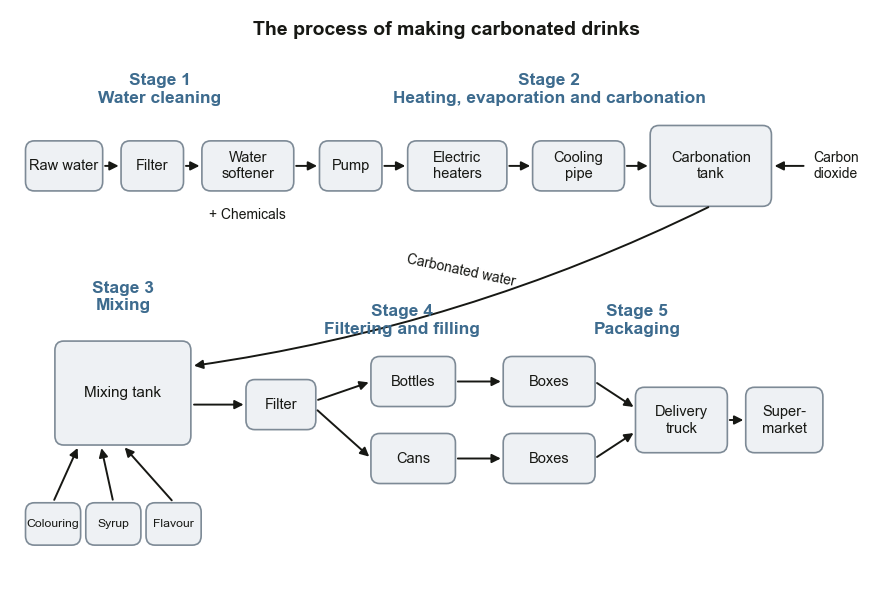
Process of Making Carbonated Drinks
The diagram gives information about the process of making carbonated drinks. Summarise the information by selecting and reporting the main features, and make comparisons where relevant.
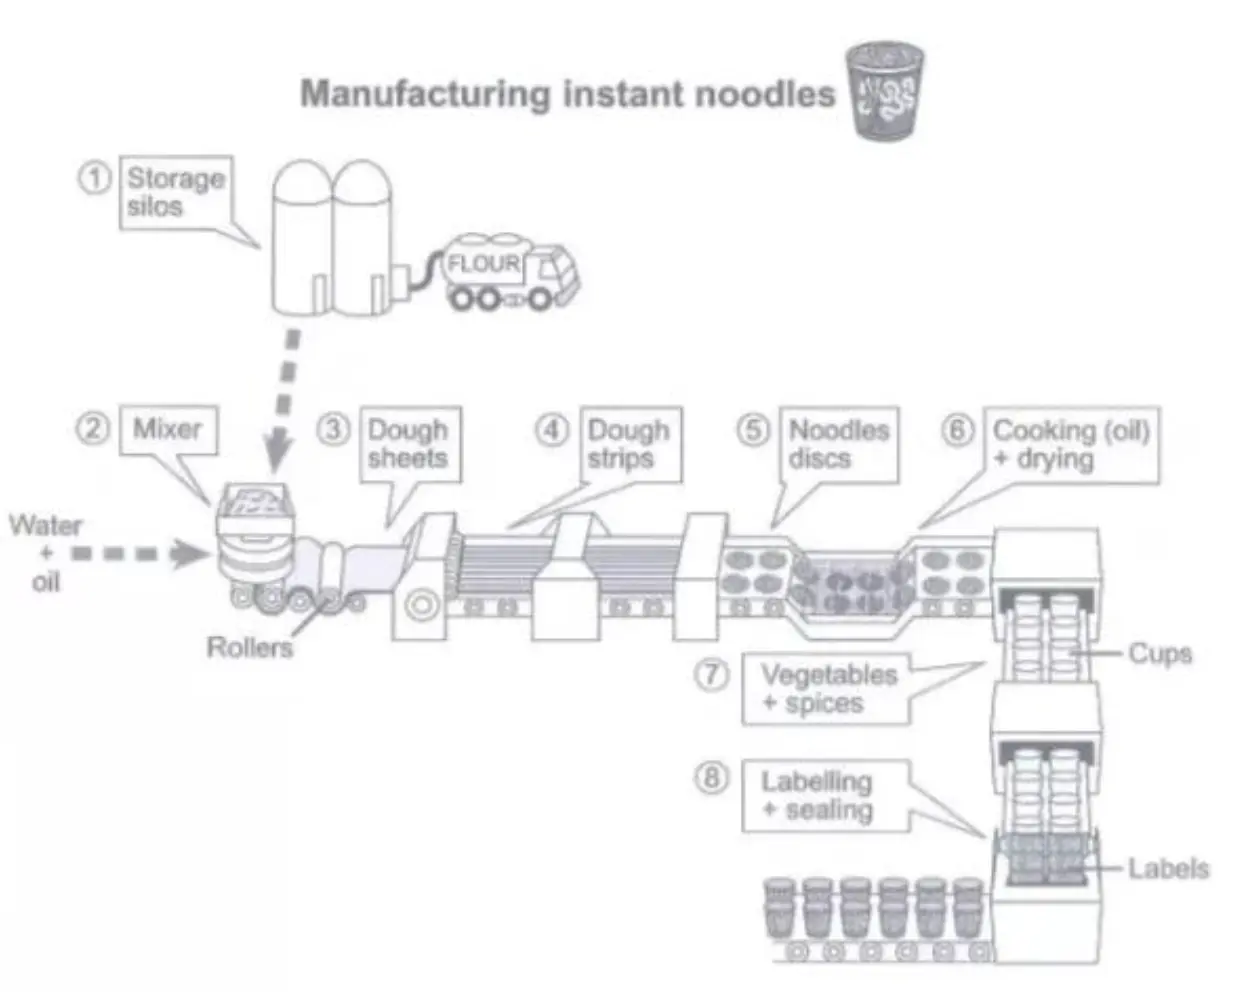
Instant Noodle Manufacturing Process
The diagram below shows how instant noodles are manufactured. Summarise the information by selecting and reporting the main features, and make comparisons where relevant.
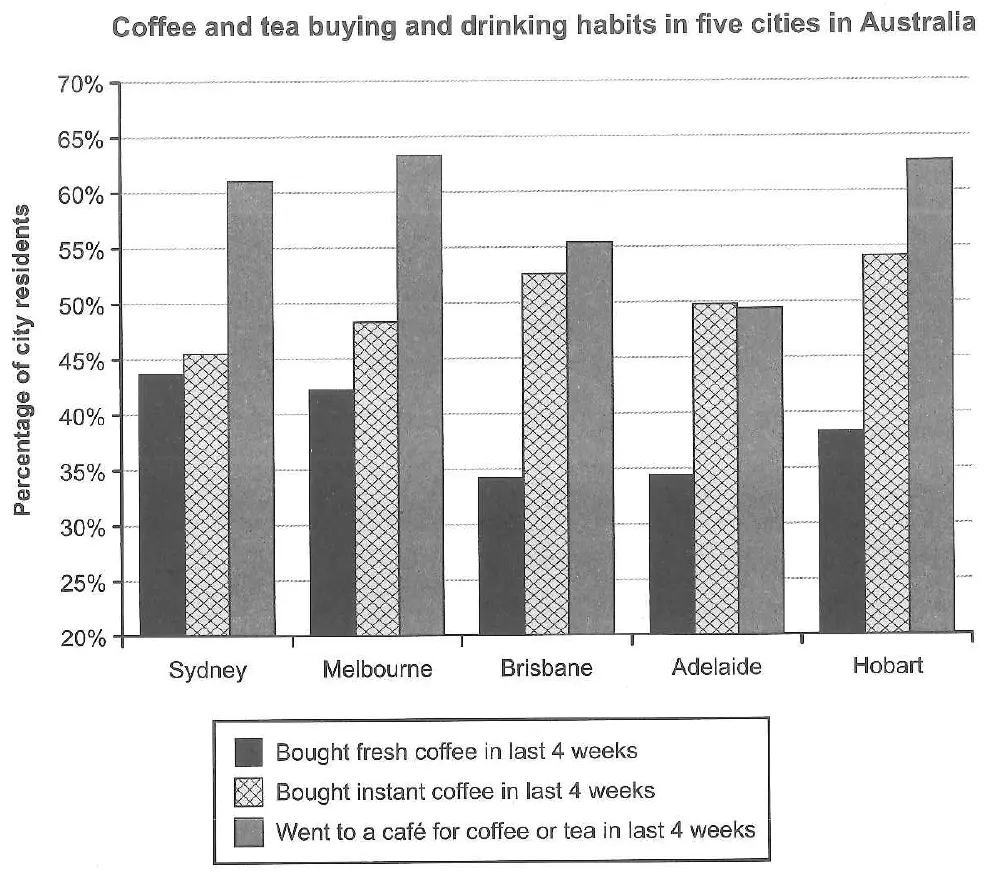
Coffee and Tea Habits in Five Australian Cities
The chart below shows the results of a survey about people’s coffee and tea buying and drinking habits in five Australian cities. Summarise the information by selecting and reporting the main features, and make comparisons where relevant.
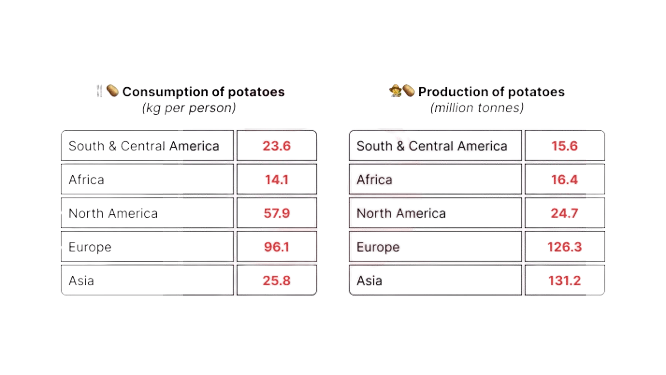
Potato Consumption and Production by Region in 2006
The tables below provide information about the consumption and production of potatoes in five parts of the world in 2006.
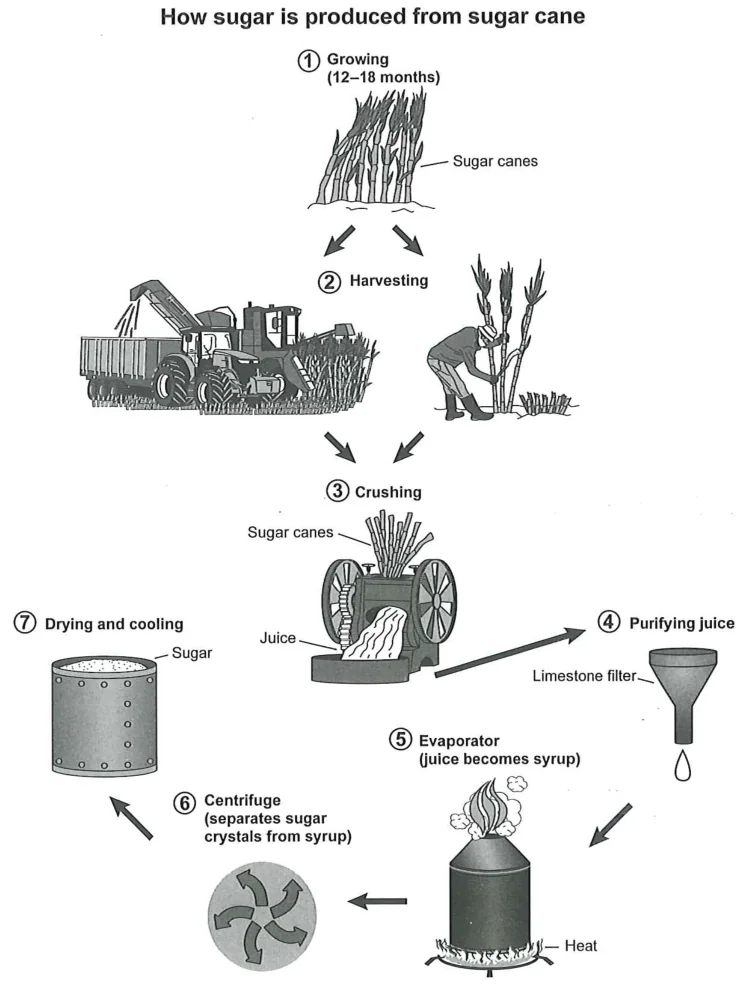
Sugar Production Process from Sugar Cane
The diagram below shows the manufacturing process for making sugar from sugar cane. Summarise the information by selecting and reporting the main features, and make comparisons where relevant.