
IELTS Academic Writing Task 1Question type
Pie charts
Compare proportions and the largest structural changes.
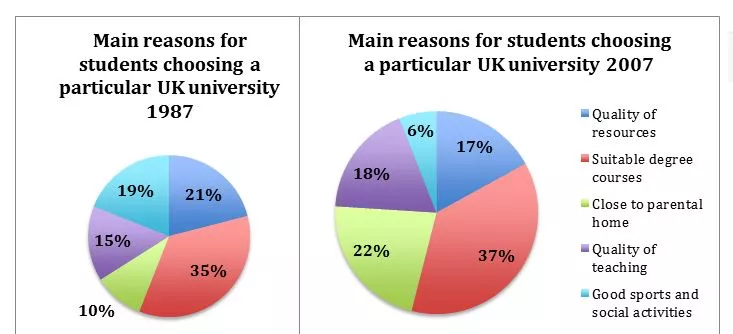
Reasons Students Chose a UK University (1987-2007)
The pie charts below show the main reasons why students chose to study at a particular UK university in 1987 and 2007. Summarise the information by selecting and reporting the main features, and make comparisons where relevant.
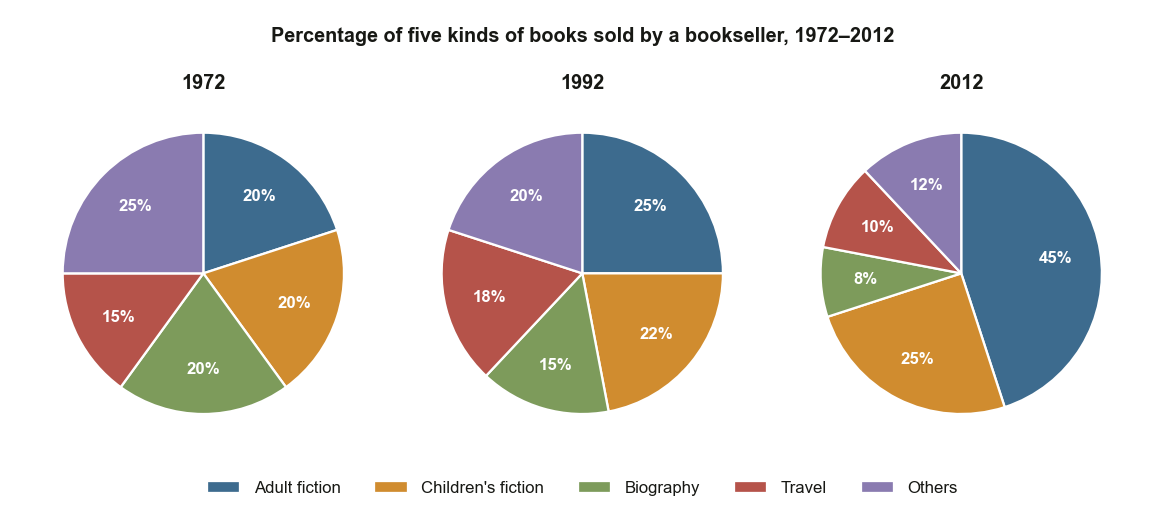
Book Sales by Genre Between 1972 and 2012
The pie charts below show the percentage of five kinds of books sold by a bookseller between 1972 and 2012. Summarise the information by selecting and reporting the main features, and make comparisons where relevant.
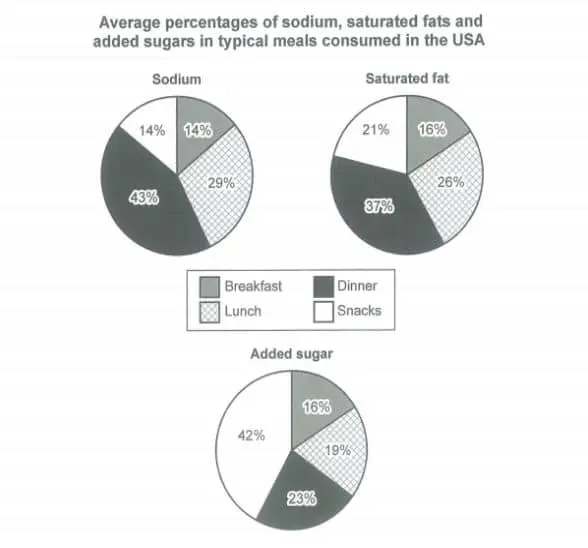
Nutrients in Typical US Meals Pie Charts
The charts below show the average percentages in typical meals of three types of nutrients, all of which may be unhealthy if eaten too much. Summarise the information by selecting and reporting the main features, and make comparisons where relevant.
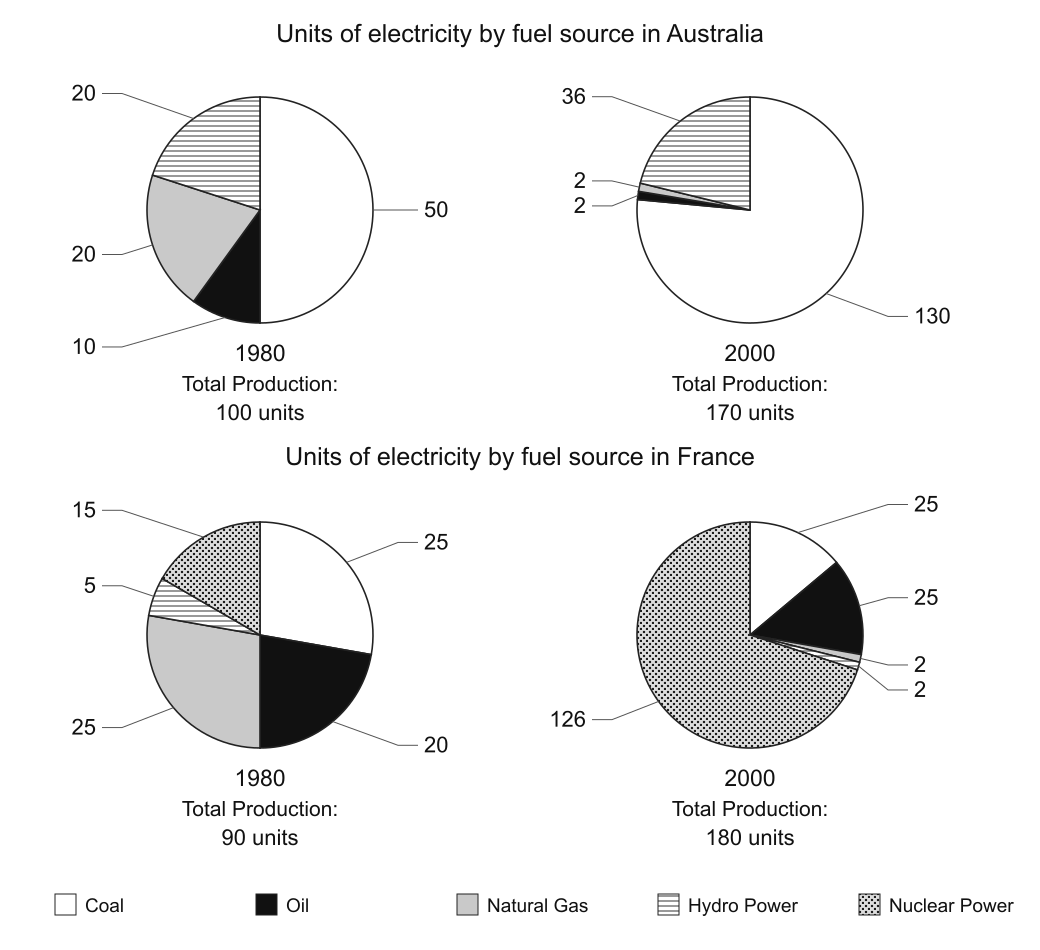
Electricity Production by Fuel in Australia and France
The pie charts below show units of electricity production by fuel source in Australia and France in 1980 and 2000.