
- 7.5
- 8.0
- 8.0
- 8.0
Response 01
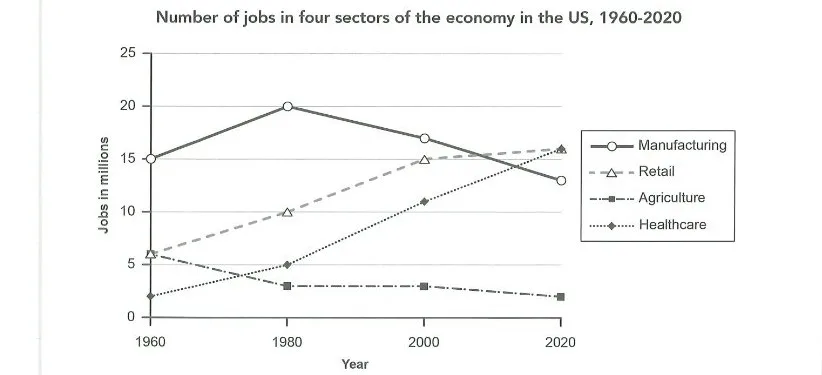
194 wordsThe line graph illustrates the changes in the number of jobs across four economic sectors in the US from 1960 to 2020. Overall, healthcare and retail experienced continuous growth, with healthcare emerging as the largest employer by the end of the period. Conversely, employment in agriculture saw a consistent decline, while manufacturing jobs fluctuated, peaking mid-period before falling. In 1960, manufacturing was the dominant sector, employing 15 million people. This figure peaked at 20 million in 1980, but then dropped steadily over the next forty years to finish at approximately 13 million in 2020. In stark contrast, agriculture started at around 6 million jobs in 1960 and experienced a downward trend throughout the entire period, shrinking to just under 2 million by 2020. Regarding the growing sectors, healthcare began with the lowest figures, at only 2 million jobs in 1960. However, it witnessed a significant and uninterrupted rise, reaching 11 million in 2000 and eventually catching up with retail at 16 million in 2020. Retail employment also grew steadily from 6 million at the start of the period to 15 million in 2000, before experiencing a slower growth rate to end at 16 million in 2020. Notably, by the end of the 60-year period, both healthcare and retail had surpassed manufacturing to become the top employment sectors.