
IELTS Academic Writing Task 1Topic
Higher education
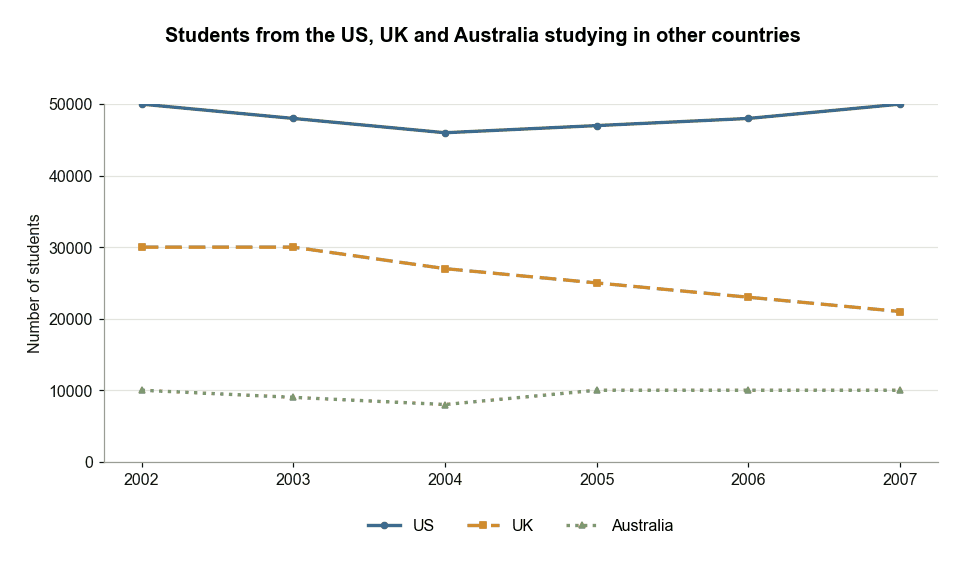
Students from US, UK and Australia Studying Abroad
The graph below provides information on the number of students from the US, UK and Australia who studied in other countries between 2002 and 2007. Summarise the information by selecting and reporting the main features, and make comparisons where relevant.
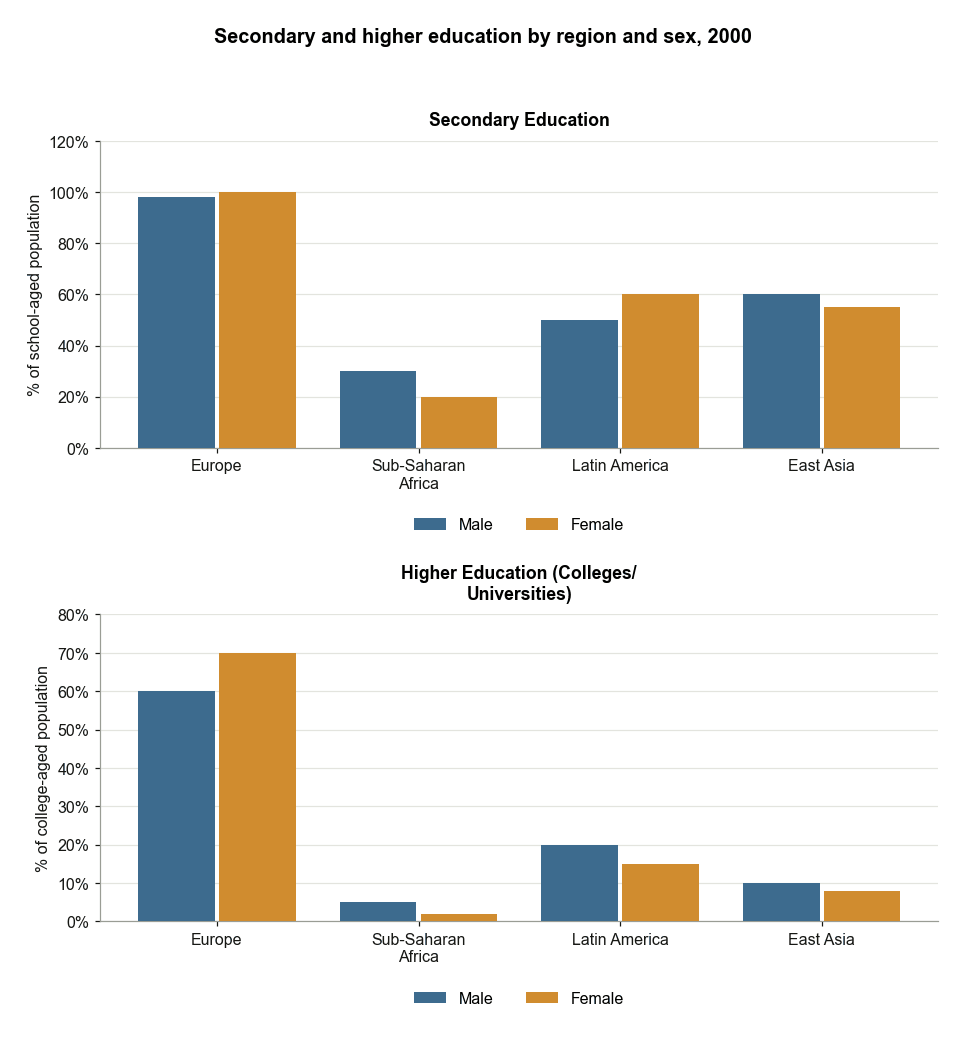
Secondary and Higher Education by Region in 2000
The first chart below shows the percentages of school-aged girls and boys who were at secondary school in four regions of the world in 2000. The second chart shows the percentages of college-aged men and women in higher education in the same year. Summarise the information by selecting and reporting the main features, and make comparisons where relevant.
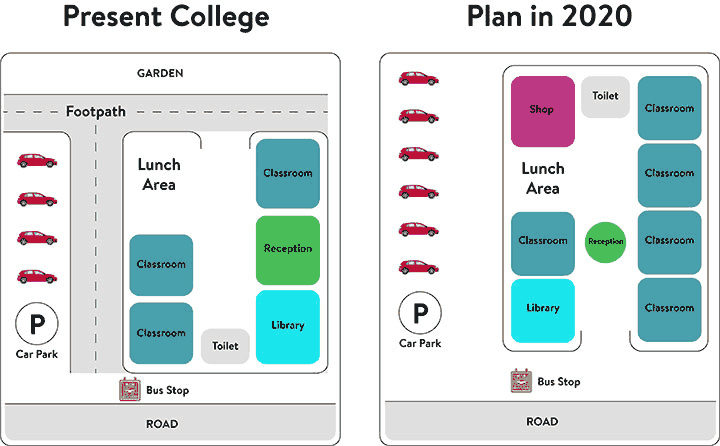
Present and Future College Site Plans
The diagrams below show the present building of a college and the plan for changes to the college site in the future. Summarise the information by selecting and reporting the main features, and make comparisons where relevant.
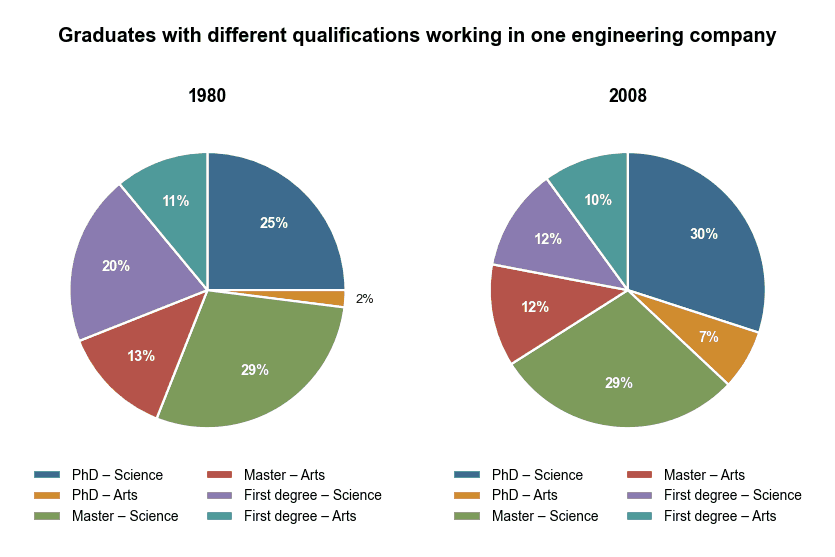
Graduate Qualifications in an Engineering Company
The charts below show the proportion of graduates with different qualifications working in one engineering company in 1980 and 2008. Summarise the information by selecting and reporting the main features, and make comparisons where relevant.
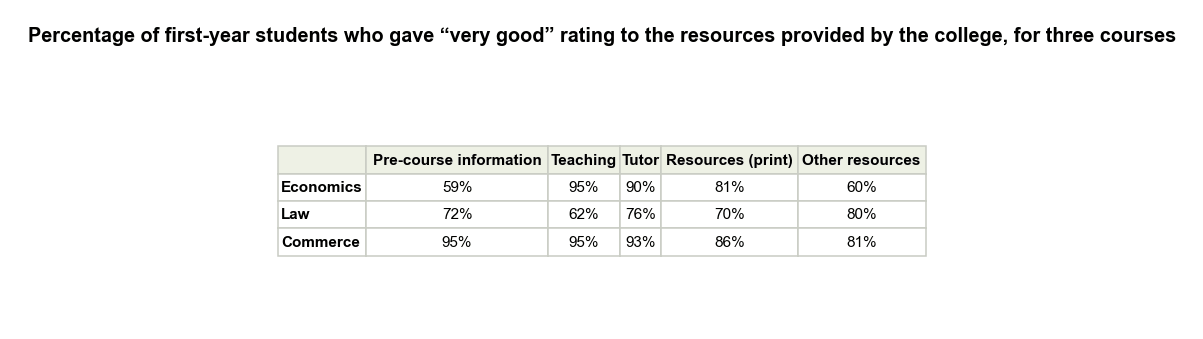
First-Year Student Ratings of College Resources
The table below shows the percentage of first year students who gave “very good” rating to the resources provided by the college, for three courses. Summarise the information by selecting and reporting the main features, and make comparisons where relevant.
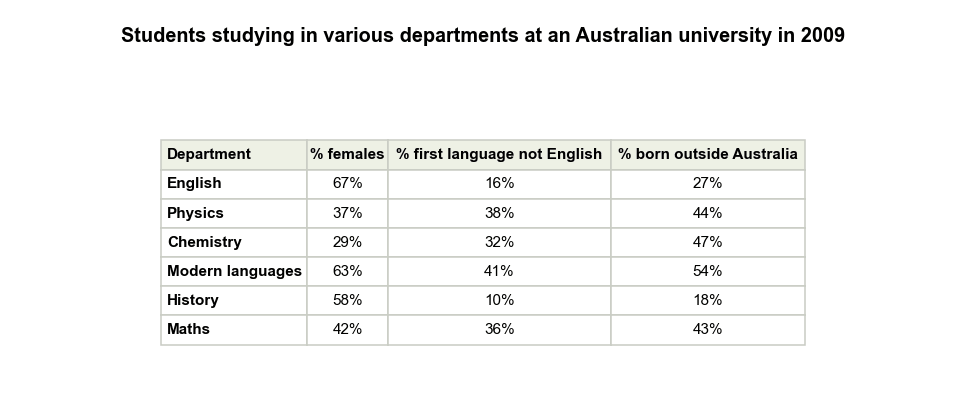
Students at an Australian University in 2009
The table shows information about students studying in six different departments at an Australian university in 2009. Summarise the information by selecting and reporting the main features, and make comparisons where relevant.
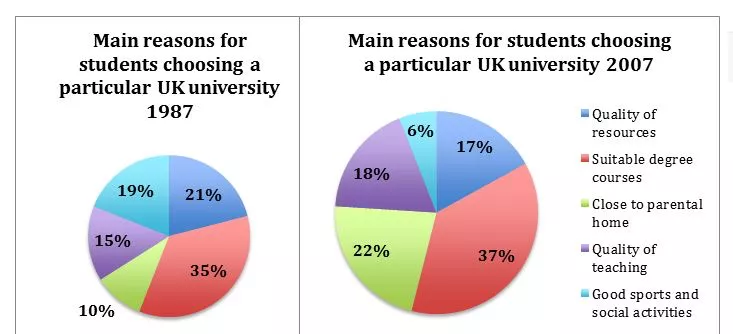
Reasons Students Chose a UK University (1987-2007)
The pie charts below show the main reasons why students chose to study at a particular UK university in 1987 and 2007. Summarise the information by selecting and reporting the main features, and make comparisons where relevant.
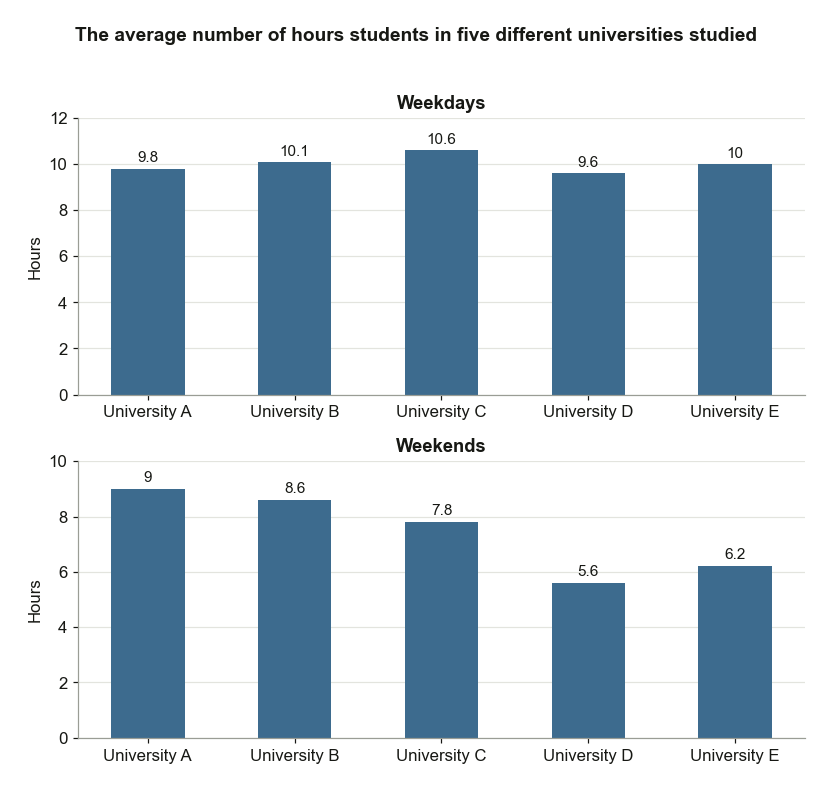
Study Hours of Students at Five Universities
The bar charts below show the average number of hours students in five different universities studied. Summarise the information by selecting and reporting the main features, and make comparisons where relevant.