
IELTS Academic Writing Task 1Topic
Transport
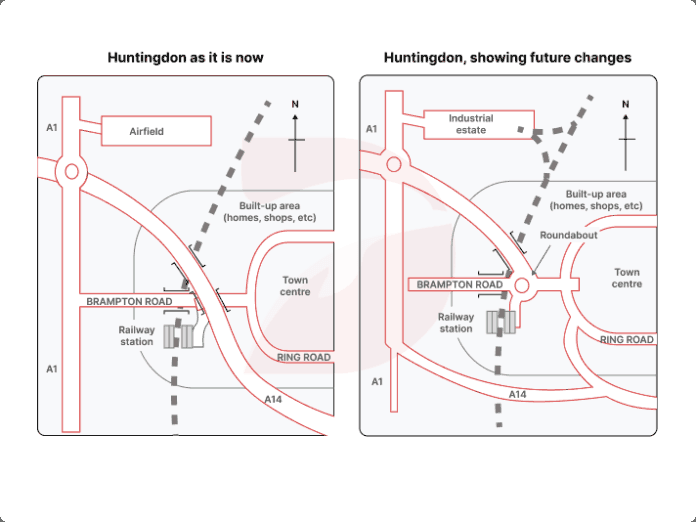
Huntingdon Present and Future Maps
The maps below show Huntingdon as it is now, and how it will change in the future. Summarise the information by selecting and reporting the main features, and make comparisons where relevant.
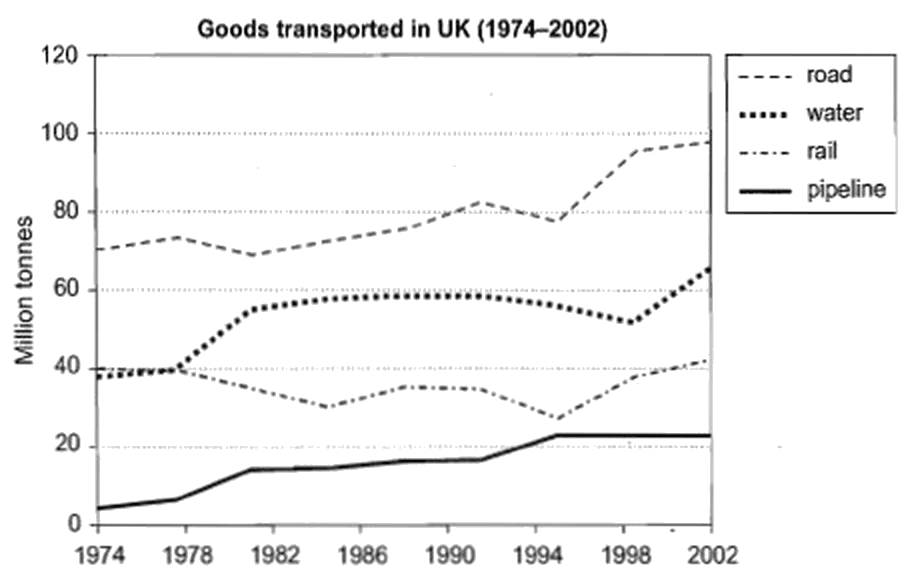
Goods Transported in the UK (1974–2002)
The graph below shows the quantities of goods transported in the UK between 1974 and 2002 by four different modes of transport. Summarise the information by selecting and reporting the main features, and make comparisons where relevant.
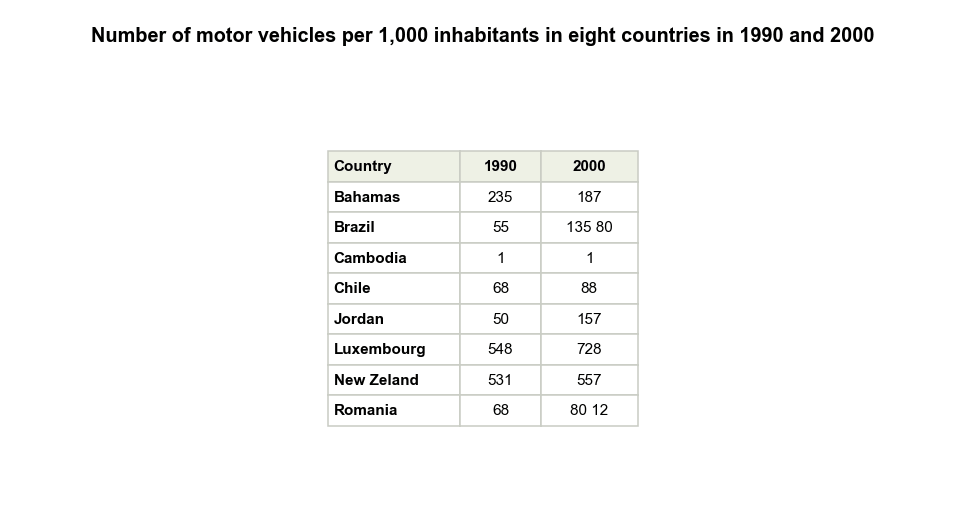
Motor Vehicles per 1,000 Inhabitants in Eight Countries
The table below shows the number of motor vehicles per 1,000 inhabitants in eight countries in 1990 and 2000. Summarise the information by selecting and reporting the main features, and make comparisons where relevant.
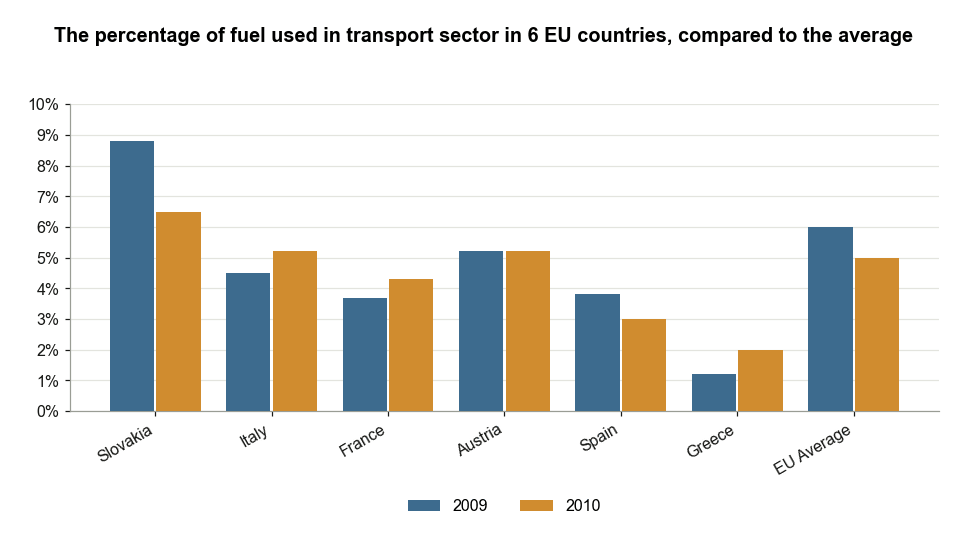
Transport Fuel Use in EU Countries, 2009–2010
The chart below shows information about fuel used in the transport sector in different countries in Europe, compared to the EU average, in 2009 and 2010. Summarise the information by selecting and reporting the main features, and make comparisons where relevant.
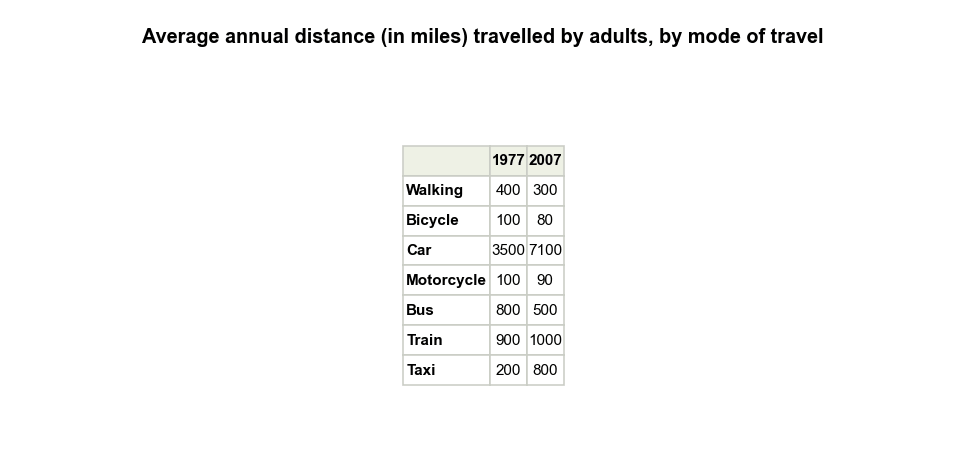
Adult Travel Distance by Mode in 1977 and 2007
The table below gives information about the average annual distance travelled by adults and the types of travel in 1977 and 2007. Summarise the information by selecting and reporting the main features, and make comparisons where relevant.
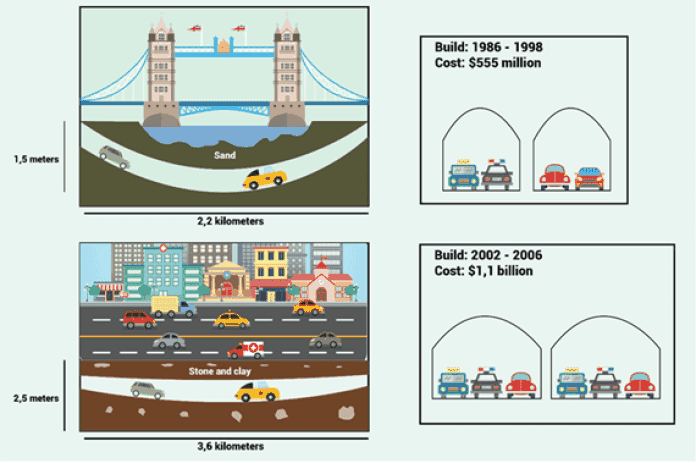
Two Road Tunnels in Australia
The diagrams below give information about two road tunnels in two Australian cities. Summarise the information by selecting and reporting the main features, and make comparisons where relevant.
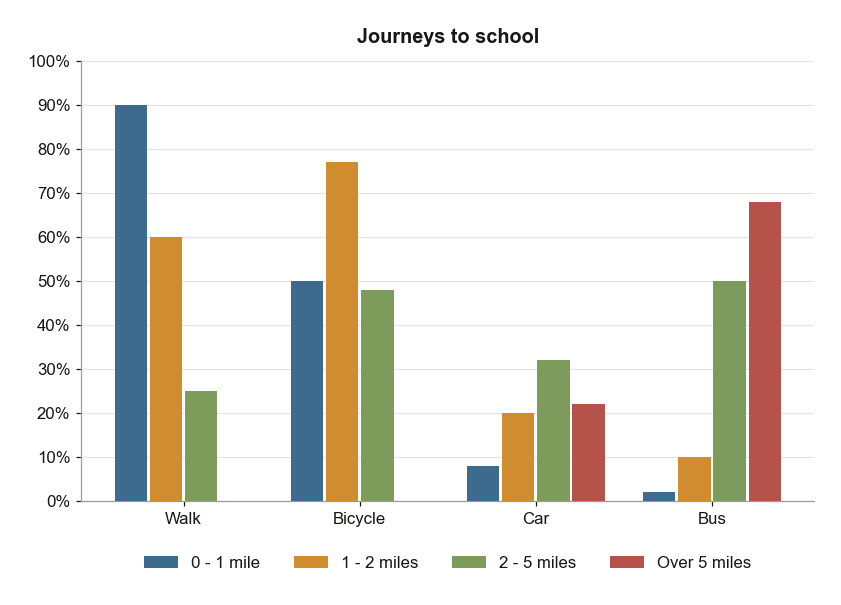
Journeys to School by UK Children Aged 11-16
The chart below gives information about the journeys to school by children aged 11 to 16 in the UK in a year. Summarise the information by selecting and reporting the main features, and make comparisons where relevant.
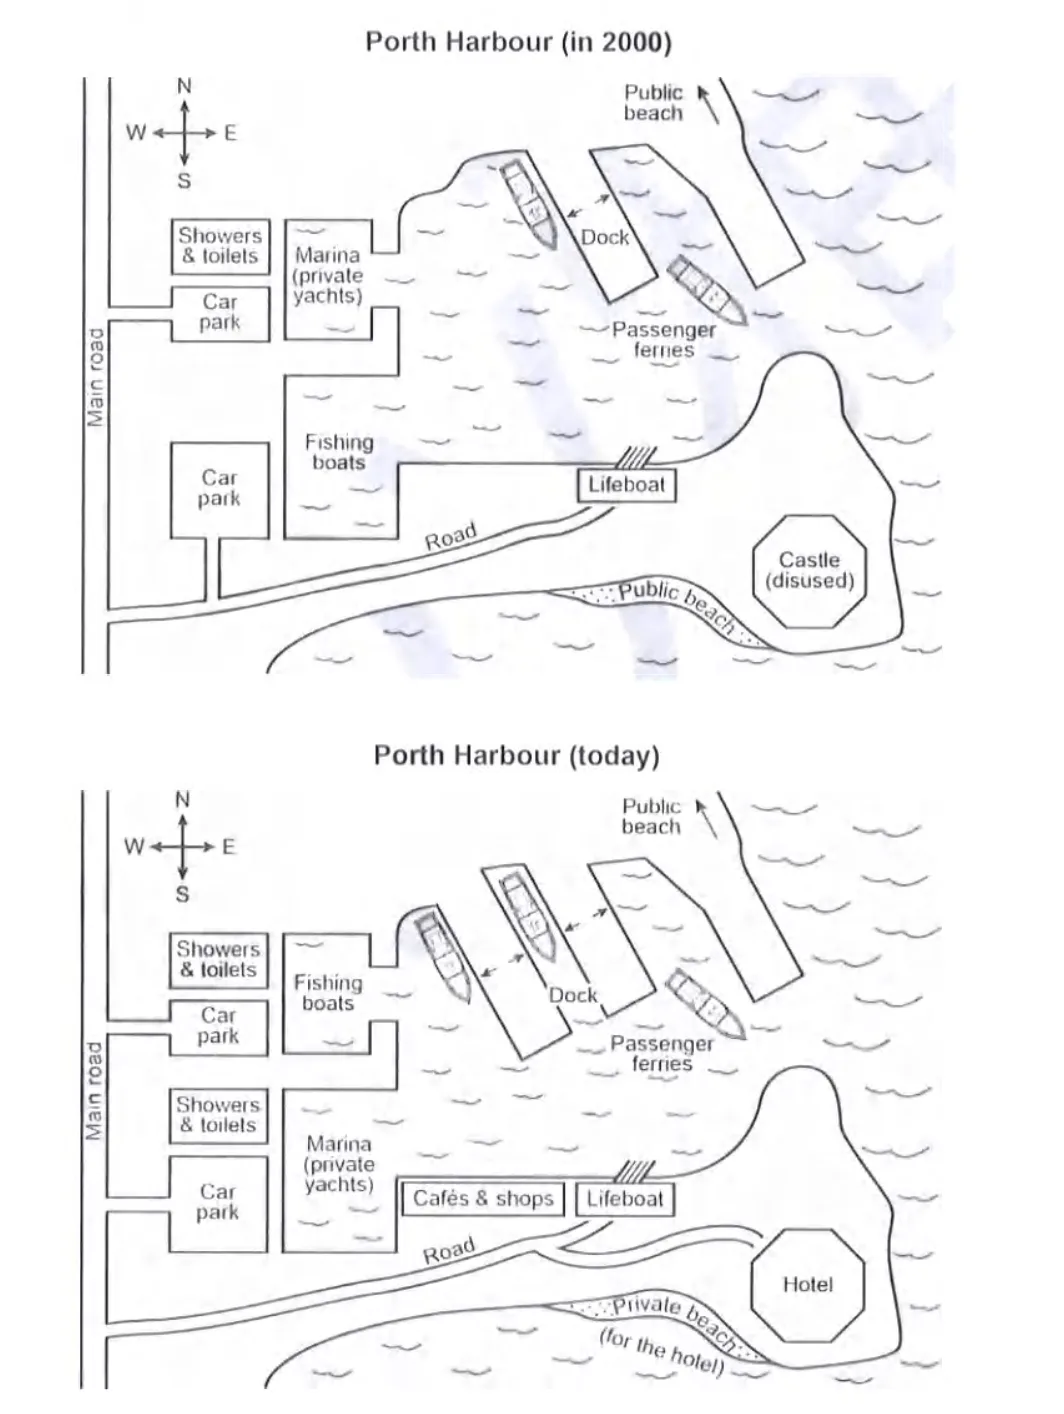
Porth Harbour in 2000 and Today Map
The plans below show a harbour in 2000 and how it looks today. Summarise the information by selecting and reporting the main features, and make comparisons where relevant.
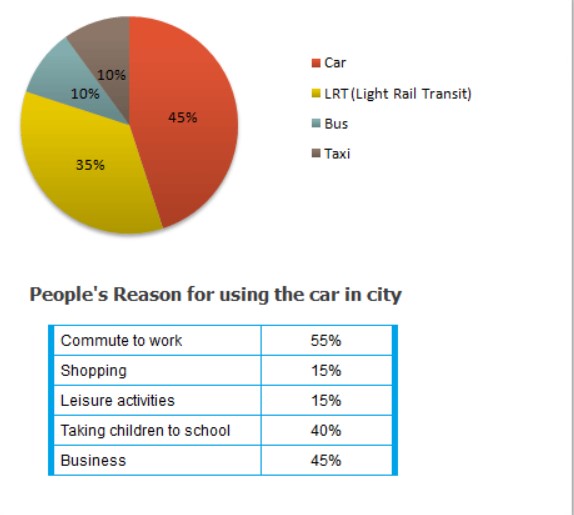
Transport and Car Use in Edmonton
The diagrams below give information on transport and car use in Edmonton.