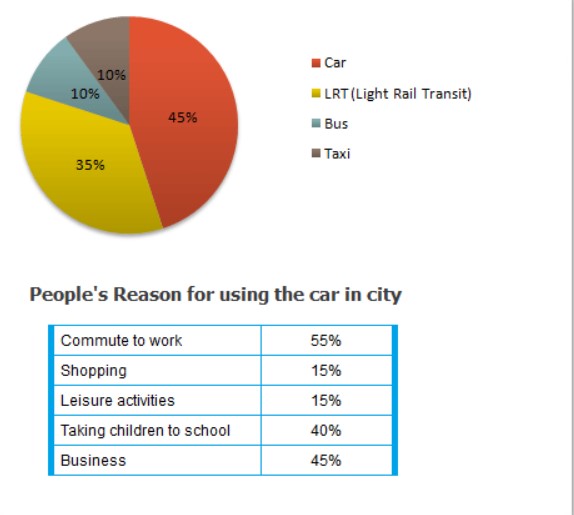
The pie chart and table chart illustrates the information regarding the Edmonton city people use the four different types of vehicle. The data has been calibrated in percentile.
Looking at the overall perspective, it is apparent that the majority of people used car for work whereas, they gave less preference to taxi as compared to other.
Apparently, it is crystal noticeable that the number of people who were using by Bus and taxi which remained same. Then they gave more preference to a car. Apart from it, the proportion of those who are using the light rail transit and Bus which was more than one third and less than one-fifth orderly. After, the percentage of use taxi for shopping was least which approximately one-tenth.
Turning towards the remaining data, the percentage of the car was higher rather than others vehicles. After that 15%of people who need to use the taxi for leisure activities—furthermore, they using the Light rail transit for taking children to school.
Estimated band6.5
7.0
6.5
6.5
6.5
Response 02
194 words
The bar graph display the reasons that people drive cars in cities while the percentage of all transportation modes which are used by different people is mentioned in the pie chart.
In an overview, the city residents use cars as their main transportation method while LRT is their secondary option. People use cars to traverse distances to work locations, business destinations, and for driving their children to school.
To begin with the pie chart, the Edmonton community uses multiple transportation methods to travel. The second highest use is LRT with 35% which is at its zenith, however, the bus and taxi are being utilised by 10 % which is not preferred as shown in the diagram.
Moving towards the bar chart, the highest percentage which people use for their transportation needs shows that 45% of people select cars as their main transportation method. The city has multiple reasons why people drive cars for work-commuting purposes which include 55% of drivers who use cars for work and 45% who drive for business purposes and 40% who use cars to take their children to school. The two other reasons people drive cars are shopping and leisure activities which both have a 15% usage rate.
Estimated band7.0
7.0
7.0
7.0
7.0
Response 03
165 words
The pie chart portrays the different types of vehicles used in Edmonton and their usage. The table shows the various reasons for using a car in Edmonton.
In an overview, the car is highly sought after in terms of transportation in Edmonton, followed by Light Rail Transit. Also, the primary reasons for using cars in this city are daily routine tasks and business.
The utilization of a car in Edmonton is the highest among any other mode of transportation, with 45% of the traffic being cars. The second most preferred mode of travel is the Light Rail Transit with 35% usage. Buses and taxis are the least used and only contribute 10% each to the total traffic.
Around 55% of people in Edmonton commute to work by car, making it the chief purpose of using a car in the city. 45% of the population use cars, for business purposes whereas 40% use them to take their children to school. Cars are used for leisure activities or shopping by 15% of the people.
Estimated band7.0
7.0
7.0
7.0
7.0
Response 04
151 words
The pie chart shows the proportion of four major types of transport that people use in Edmonton and the table indicates why people use their cars in the city.
As can be seen from the pie chart, car is the most popular means of transport, accounting for 45% of the total. The second most popular form of transport is the LRT, which represents 35%, while the usage of bus and taxi only occupies 10% respectively.
The table gives more detailed information about people’s purposes for using their cars. Surprisingly, 55% of people use cars to commute to work. Cars are also used a lot for business purposes (45%) and for taking children to school (40%). However, only 15% of people need the cars for shopping and, similarly, another 15% of them go for leisure activities by car.
Overall, there are multiple choices of transport for people living in Edmonton but a lot of people depend on cars for travelling.
TA Task AchievementCC Coherence & CohesionLR Lexical ResourceGRA Grammatical Range & Accuracy
From essays on this question
Useful vocabulary
main transportation method
Meaning
The way people use most often to travel from place to place.
From the essay
In an overview, the city residents use cars as their main transportation method while LRT is their secondary option.