
IELTS Academic Writing Task 1Topic
Schools
Bar chart
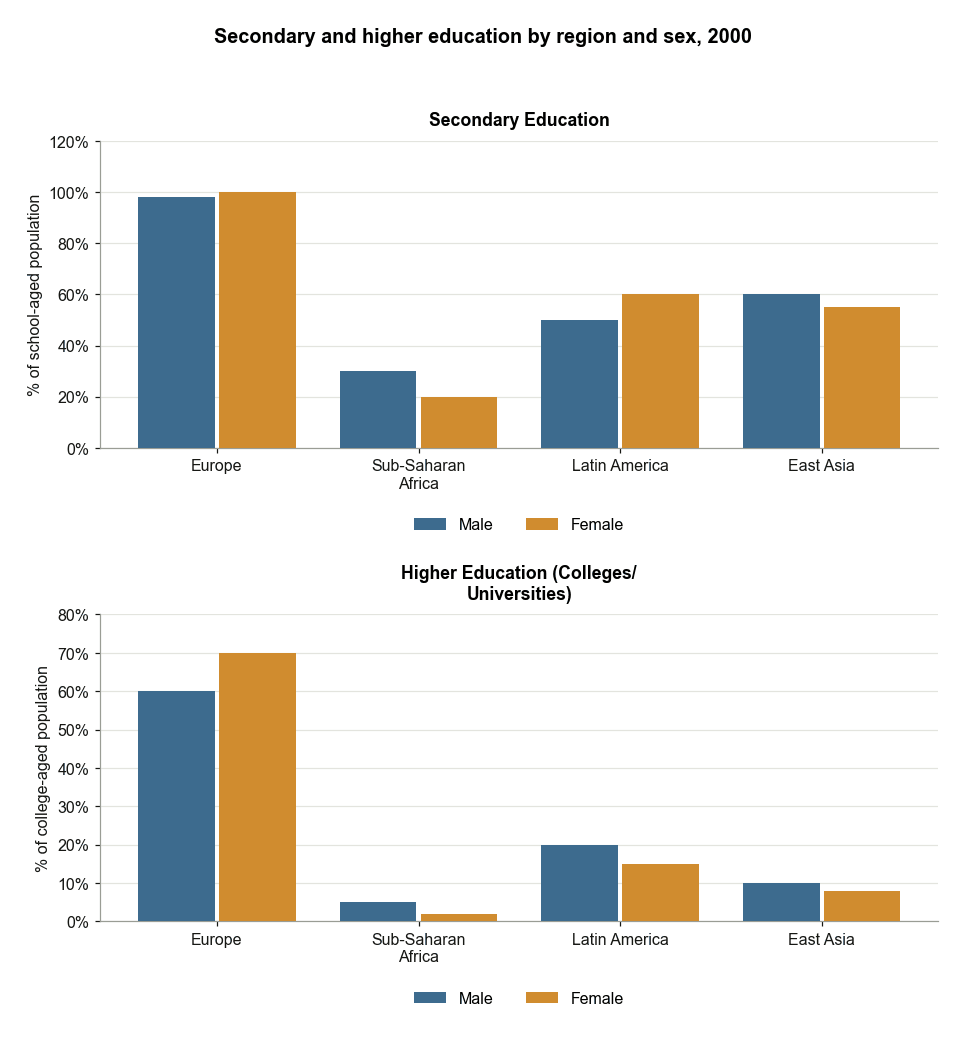
Secondary and Higher Education by Region in 2000
The first chart below shows the percentages of school-aged girls and boys who were at secondary school in four regions of the world in 2000. The second chart shows the percentages of college-aged men and women in higher education in the same year. Summarise the information by selecting and reporting the main features, and make comparisons where relevant.
Bar chart
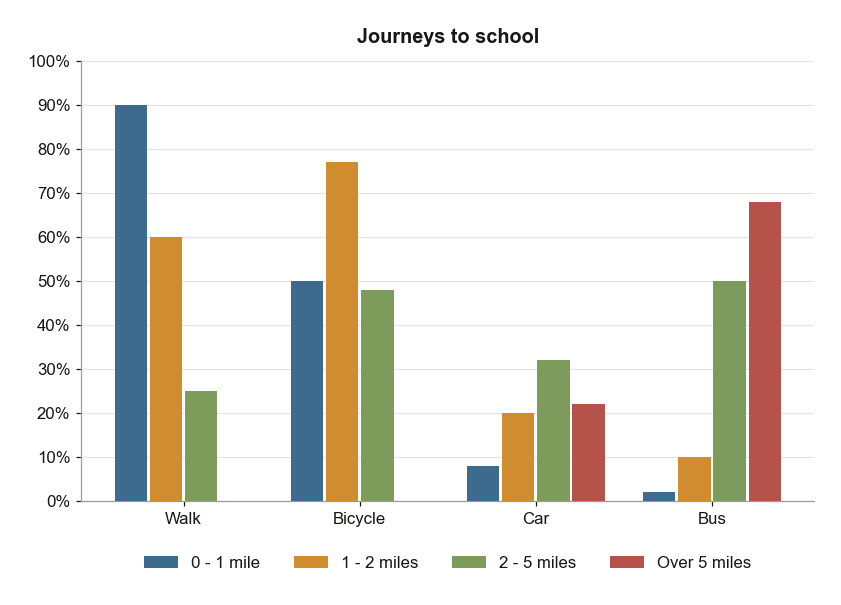
Journeys to School by UK Children Aged 11-16
The chart below gives information about the journeys to school by children aged 11 to 16 in the UK in a year. Summarise the information by selecting and reporting the main features, and make comparisons where relevant.
Map
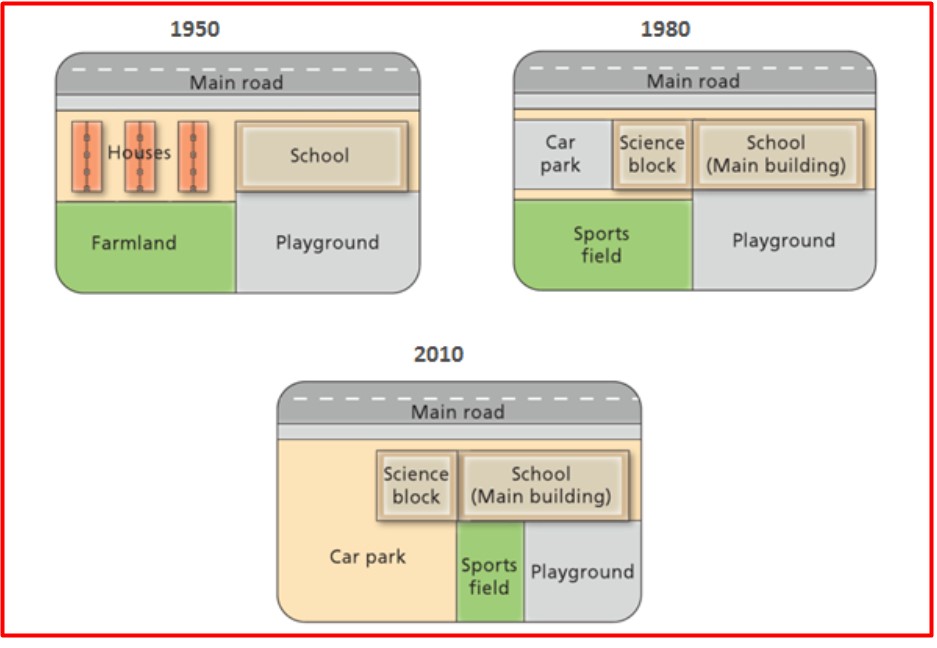
Changes at West Park Secondary School Since 1950
The diagrams below show the changes that have taken place at west park Secondary school since its construction in 1950.