
IELTS Academic Writing Task 1Topic
Energy
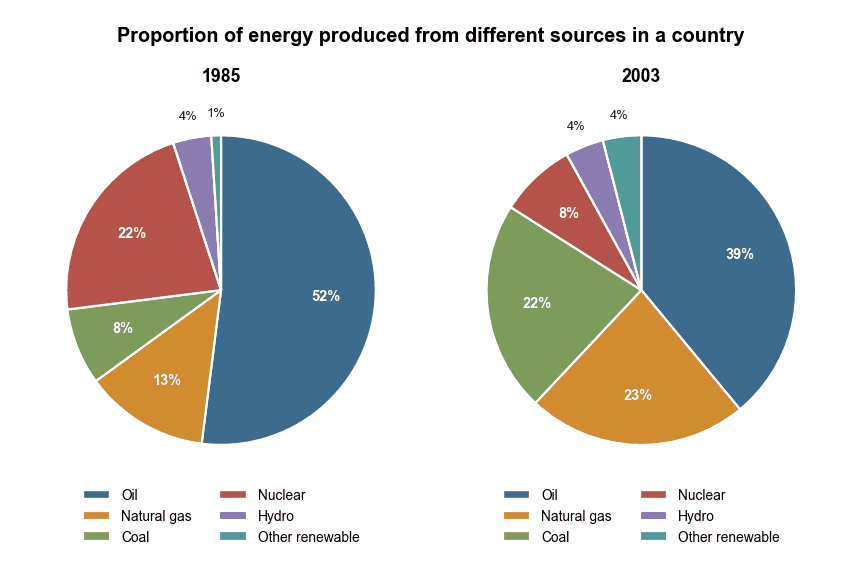
Energy Production by Source from 1985 to 2003
The charts below show the proportion of the energy produced from different sources in a country between 1985 and 2003. Summarise the information by selecting and reporting the main features, and make comparisons where relevant.
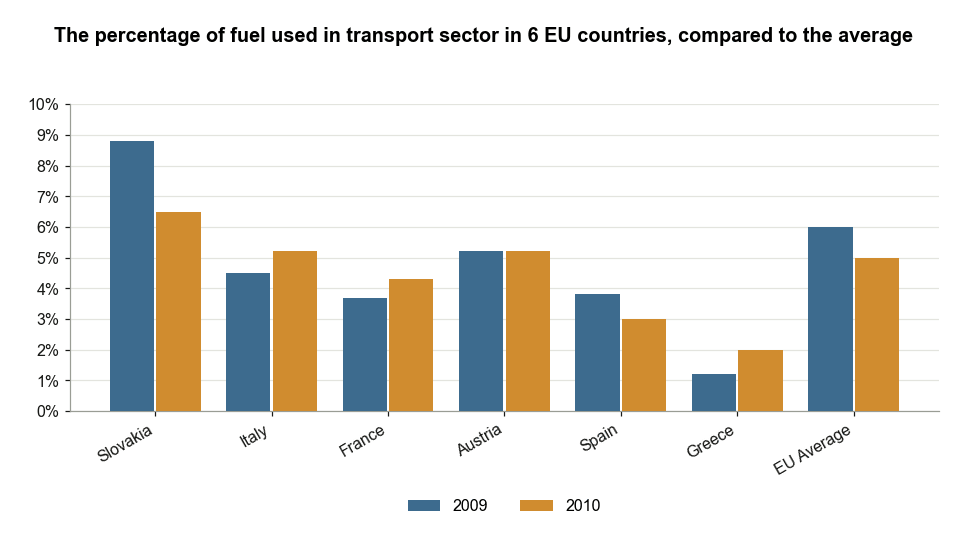
Transport Fuel Use in EU Countries, 2009–2010
The chart below shows information about fuel used in the transport sector in different countries in Europe, compared to the EU average, in 2009 and 2010. Summarise the information by selecting and reporting the main features, and make comparisons where relevant.
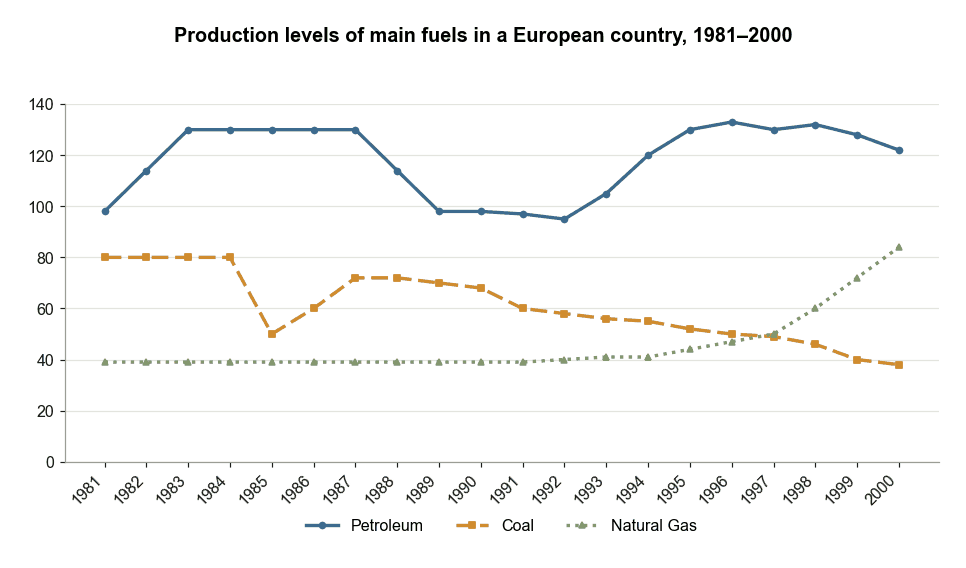
Fuel Production in a European Country 1981–2000
The graph below shows the production levels of main fuels in a European country from 1981 to 2000. Summarise the information by selecting and reporting the main features, and make comparisons where relevant.
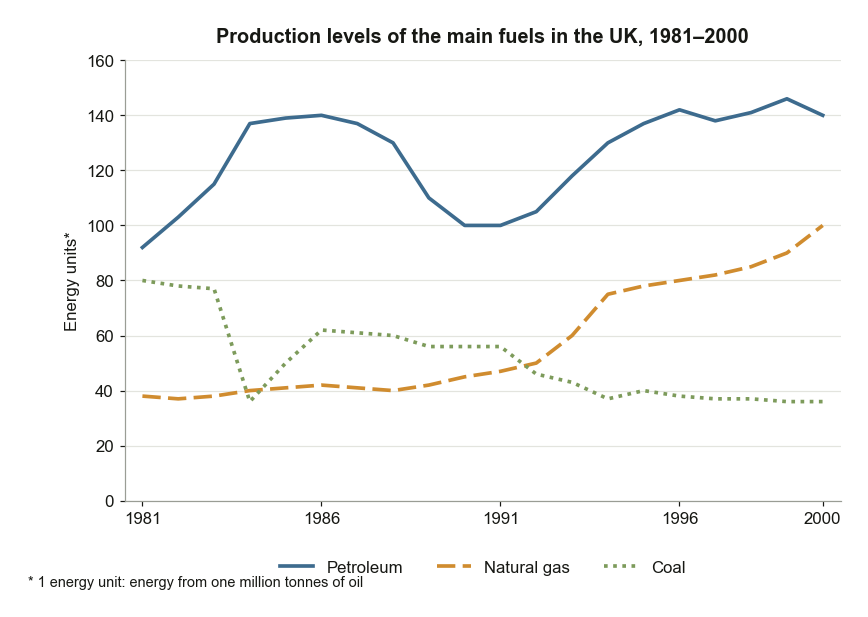
UK Fuel Production Levels Between 1981 and 2000
The graph below shows the production levels of the main kinds of fuel in the UK between 1981 and 2000. Summarise the information by selecting and reporting the main features, and make comparisons where relevant.
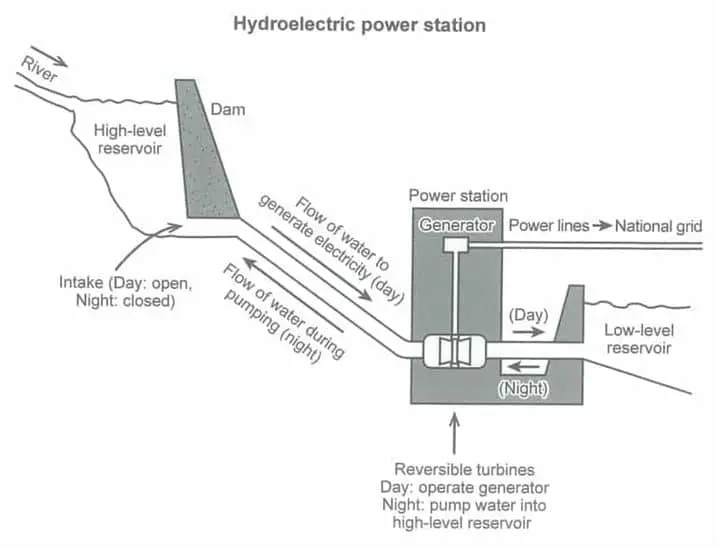
Electricity Generation in a Hydroelectric Power Station
The diagram below shows how electricity is generated in a hydroelectric power station. Summarise the information by selecting and reporting the main features, and make comparisons where relevant.
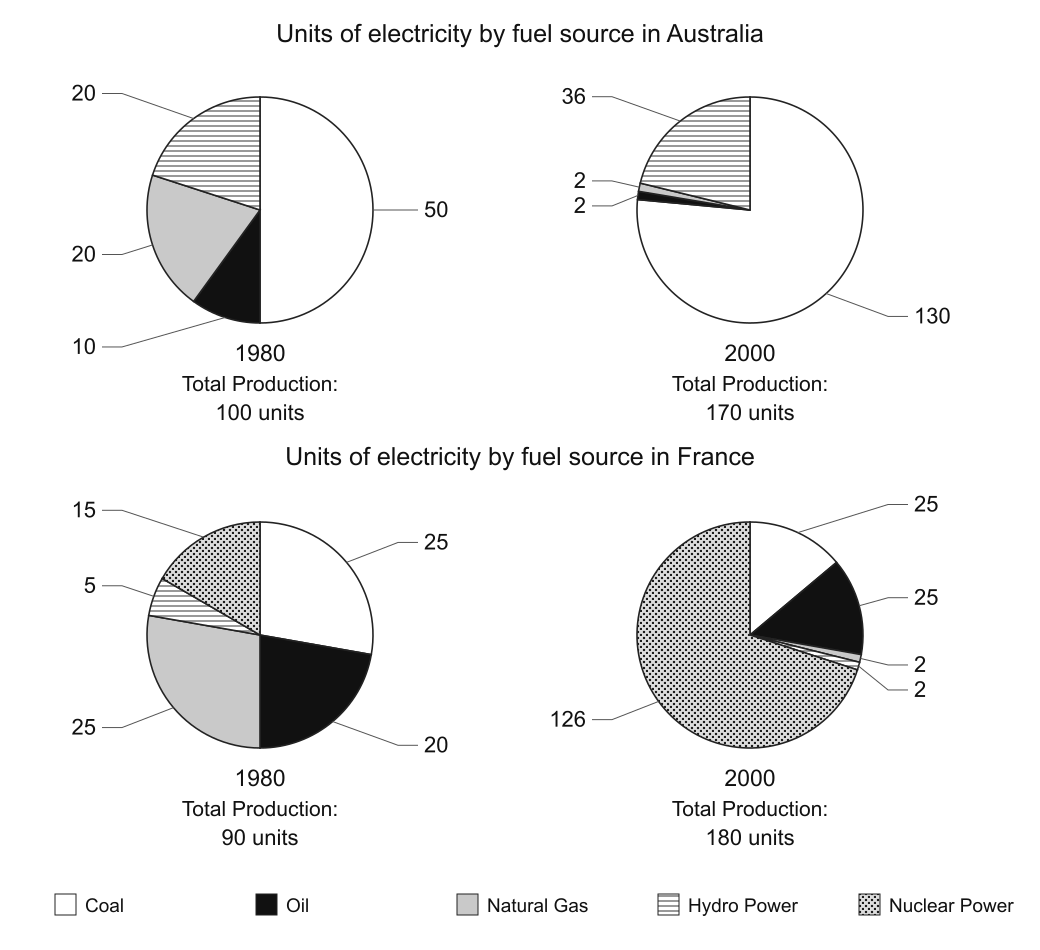
Electricity Production by Fuel in Australia and France
The pie charts below show units of electricity production by fuel source in Australia and France in 1980 and 2000.