
IELTS Academic Writing Task 1Topic
Cars
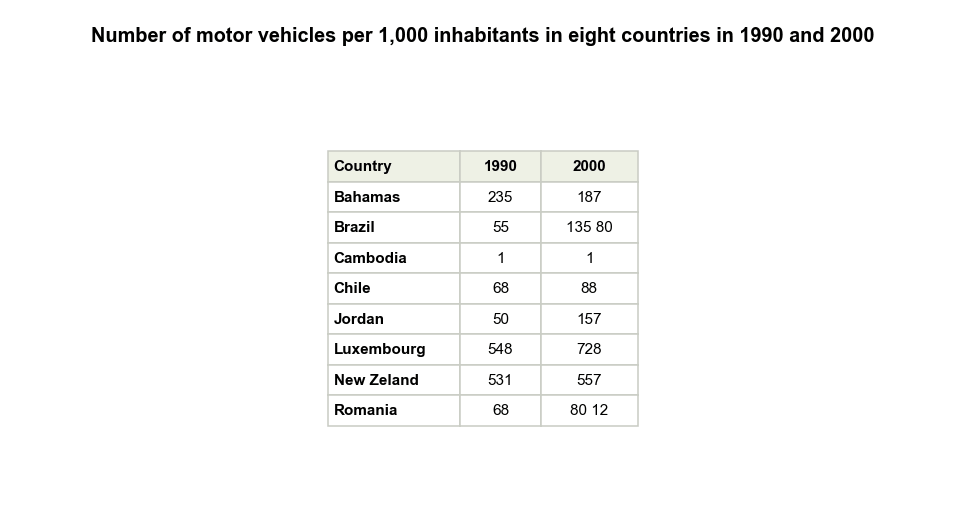
Motor Vehicles per 1,000 Inhabitants in Eight Countries
The table below shows the number of motor vehicles per 1,000 inhabitants in eight countries in 1990 and 2000. Summarise the information by selecting and reporting the main features, and make comparisons where relevant.
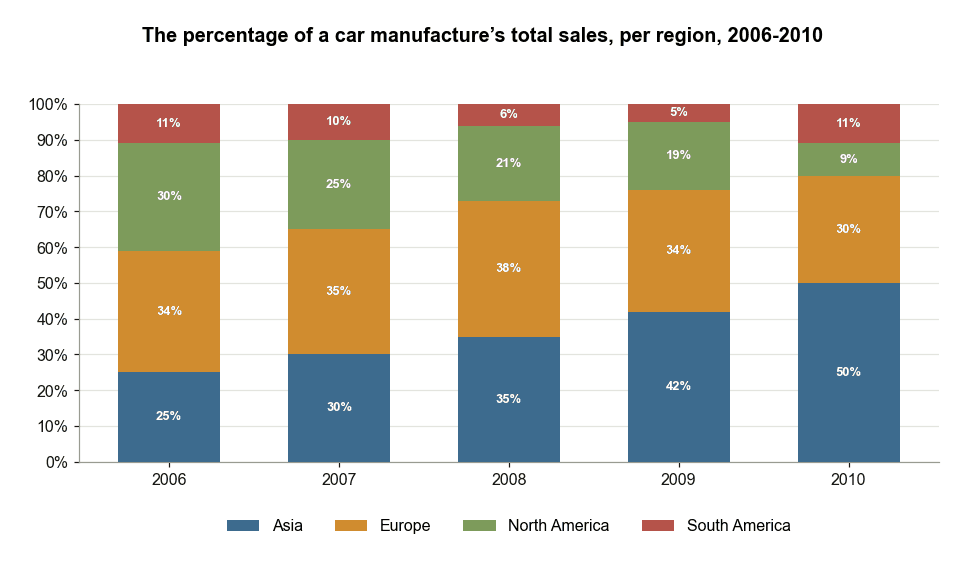
Car Manufacturer Sales by Region 2006 to 2010
The chart below shows the percentage of a car manufacturer’s total sales in various regions from 2006 to 2010. Summarise the information by selecting and reporting the main features, and make comparisons where relevant.
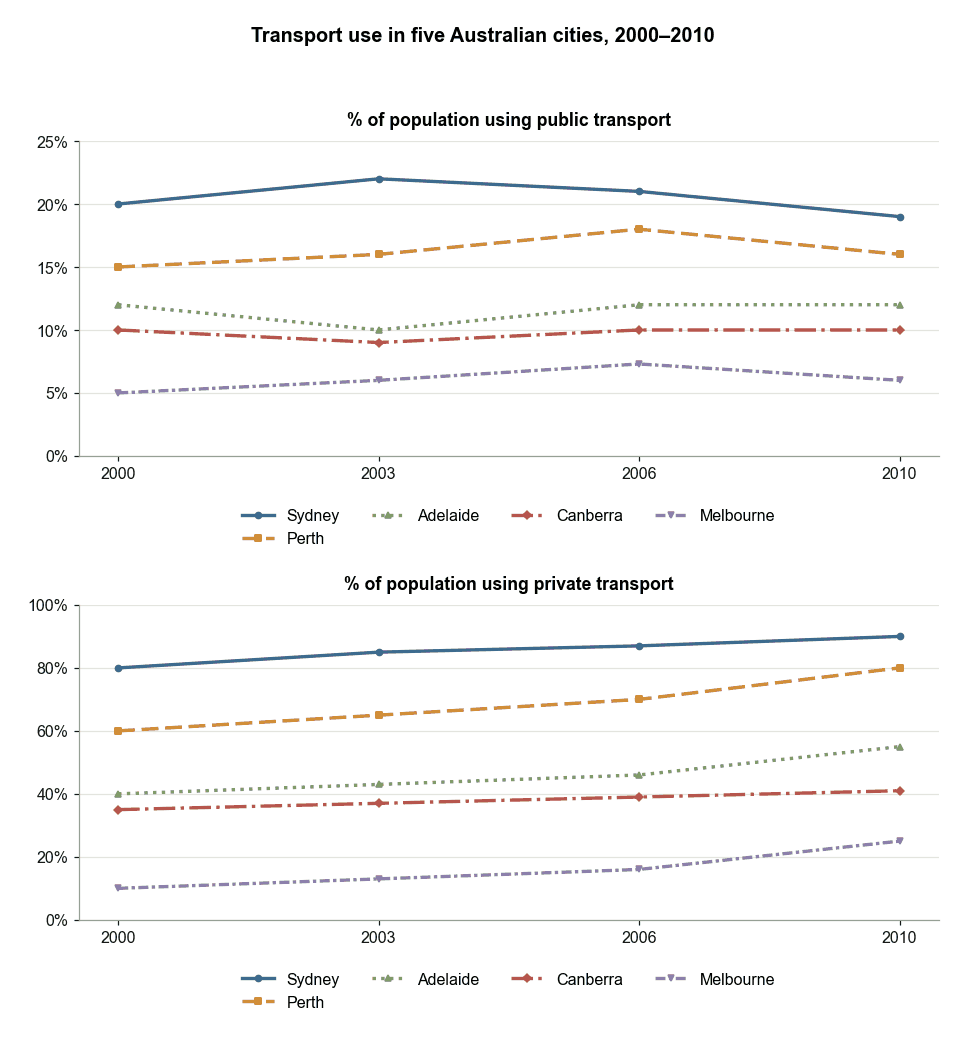
Transport Use in Five Australian Cities
The percentage of people using public transport and only using private cars in five cities in Australia from 2000 to 2010. Summarise the information by selecting and reporting the main features, and make comparisons where relevant.
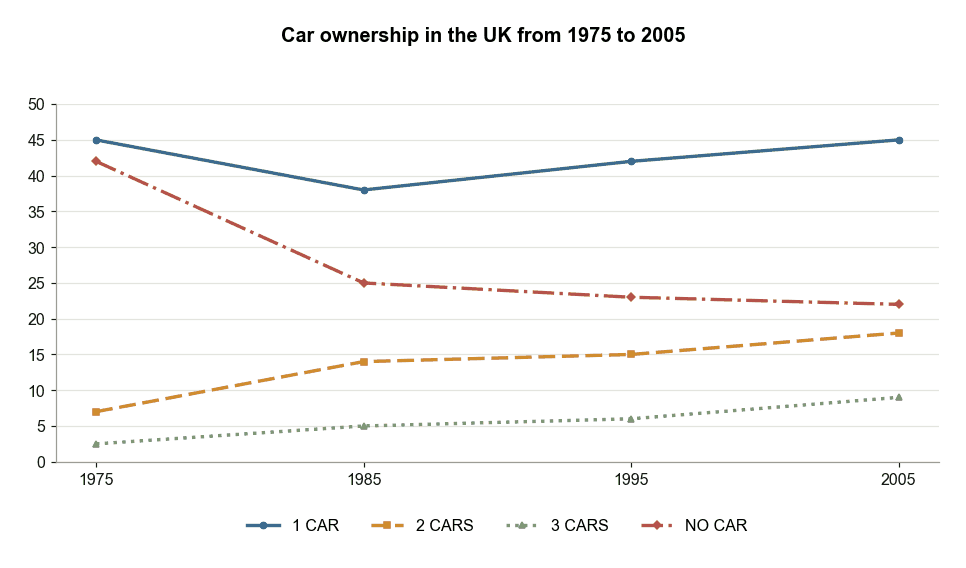
Car Ownership in the UK from 1975 to 2005
The chart below gives information about car ownership in the UK from 1975 to 2005. Summarise the information by selecting and reporting the main features, and make comparisons where relevant.
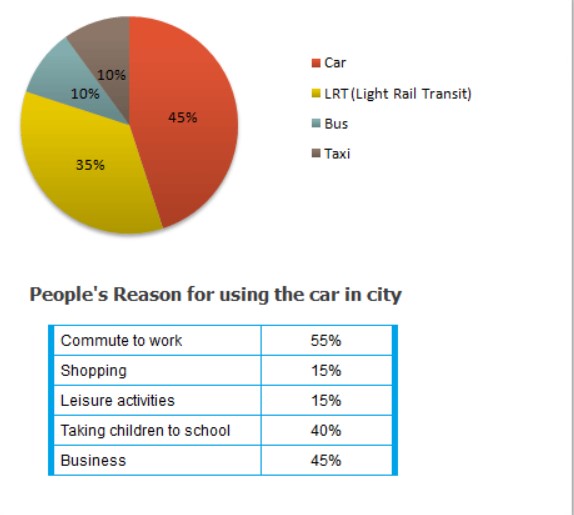
Transport and Car Use in Edmonton
The diagrams below give information on transport and car use in Edmonton.