
IELTS Academic Writing Task 1Topic
International trade
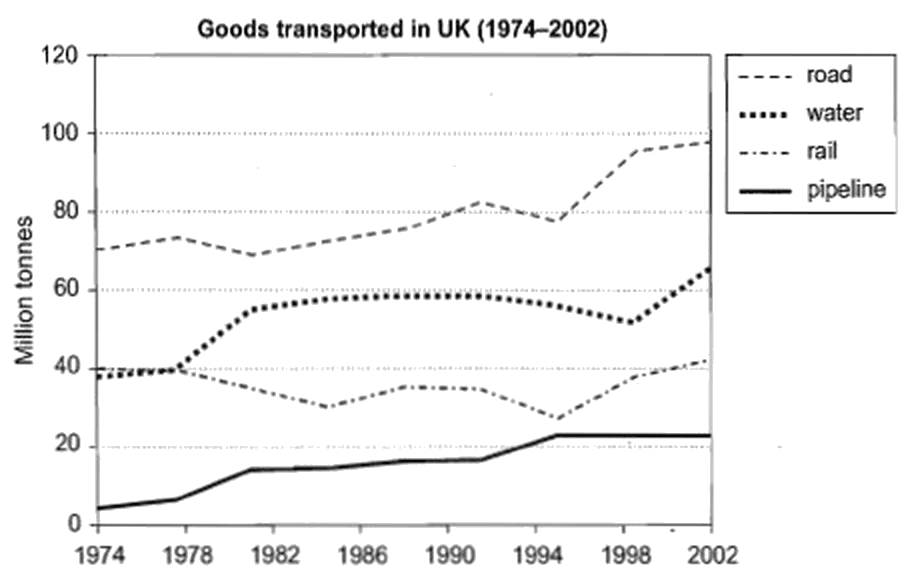
Goods Transported in the UK (1974–2002)
The graph below shows the quantities of goods transported in the UK between 1974 and 2002 by four different modes of transport. Summarise the information by selecting and reporting the main features, and make comparisons where relevant.
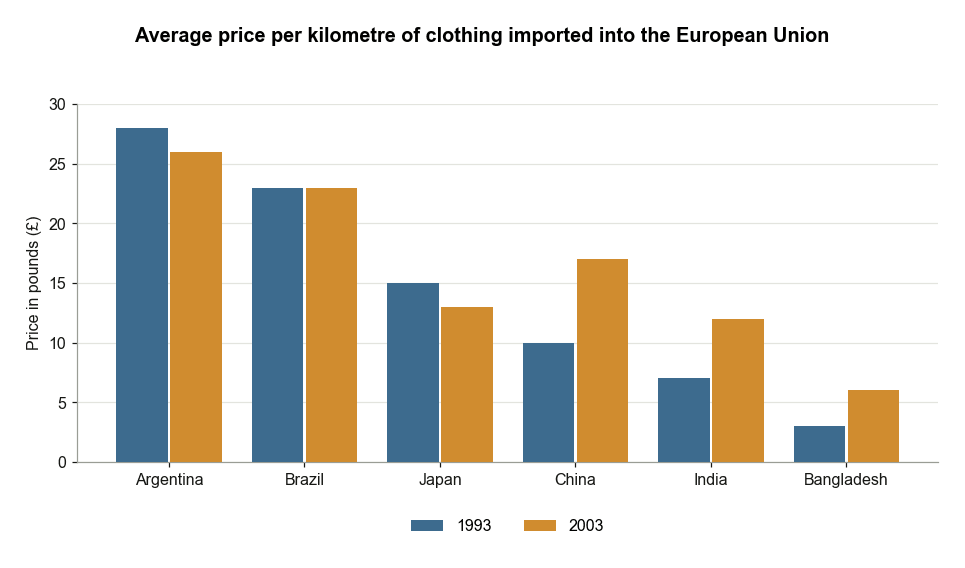
EU Clothing Import Prices per Kilometre, 1993 and 2003
The bar chart shows the average prices per kilometre of clothing imported into the European Union from six different countries in 1993 and 2003. Summarise the information by selecting and reporting the main features, and make comparisons where relevant.
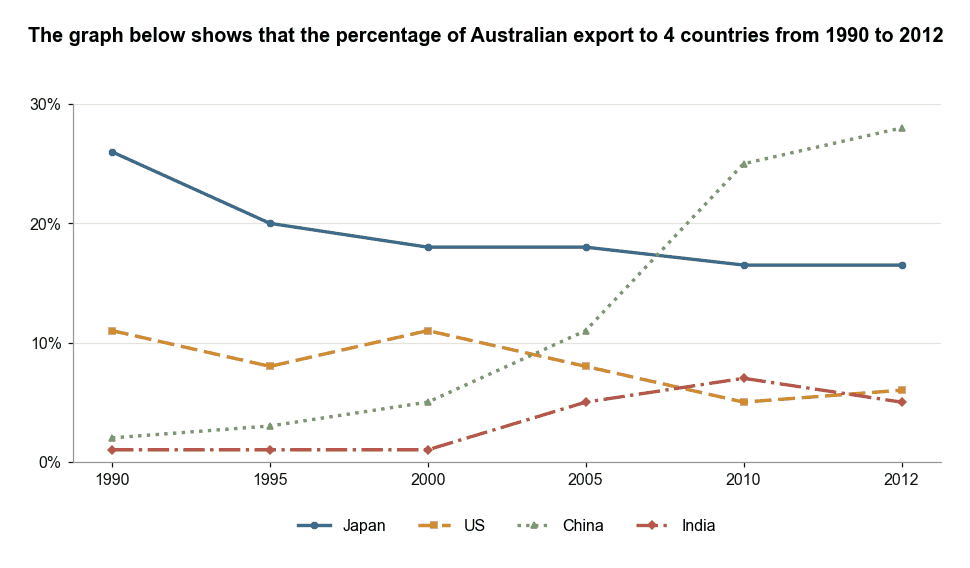
Australian Exports to Four Countries (1990-2012)
The graph below shows the percentage of Australian exports to 4 countries from 1990 to 2012. Summarise the information by selecting and reporting the main features, and make comparisons where relevant.
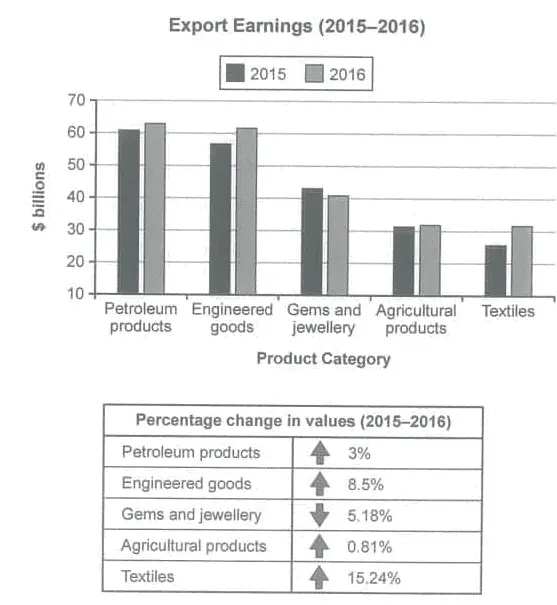
Export Earnings by Category in 2015 and 2016
The chart below shows the value of one country’s exports in various categories during 2015 and 2016. The table shows the percentage change in each category of exports in 2016 compared with 2015. Summarise the information by selecting and reporting the main features, and make comparisons where relevant.