
IELTS Academic Writing Task 1Topic
Tourism
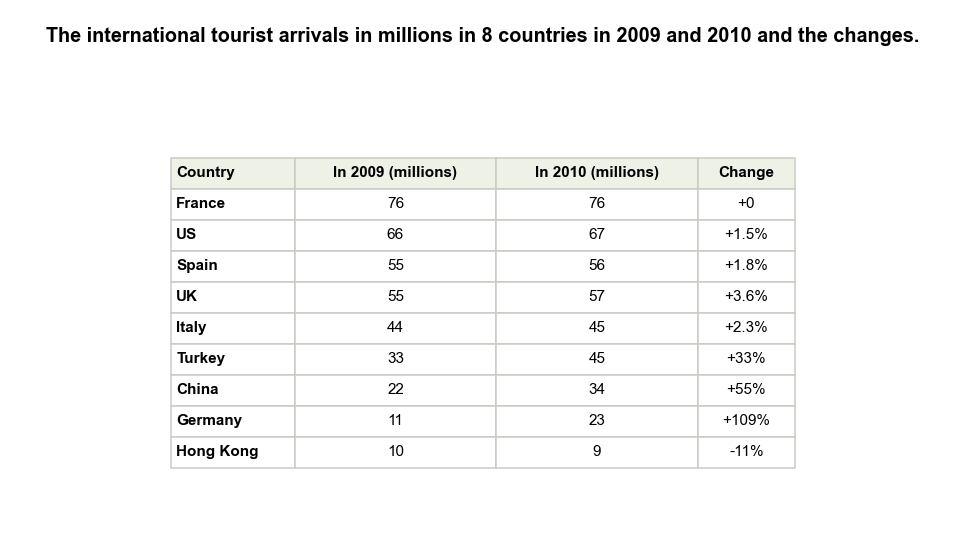
International Visitor Arrivals in 2009 and 2010
The table shows the number of international visitor arrivals in nine countries and the percentage changes between 2009 and 2010. Summarise the information by selecting and reporting the main features, and make comparisons where relevant.
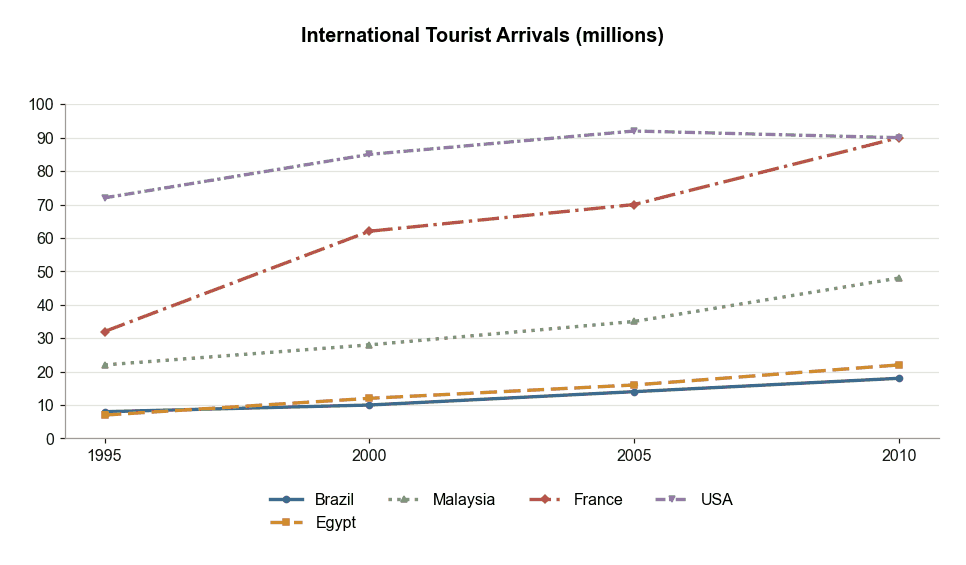
International Tourist Arrivals in Five Countries
The graph below gives information about international tourist arrivals in five countries. Summarise the information by selecting and reporting the main features, and make comparisons where relevant.
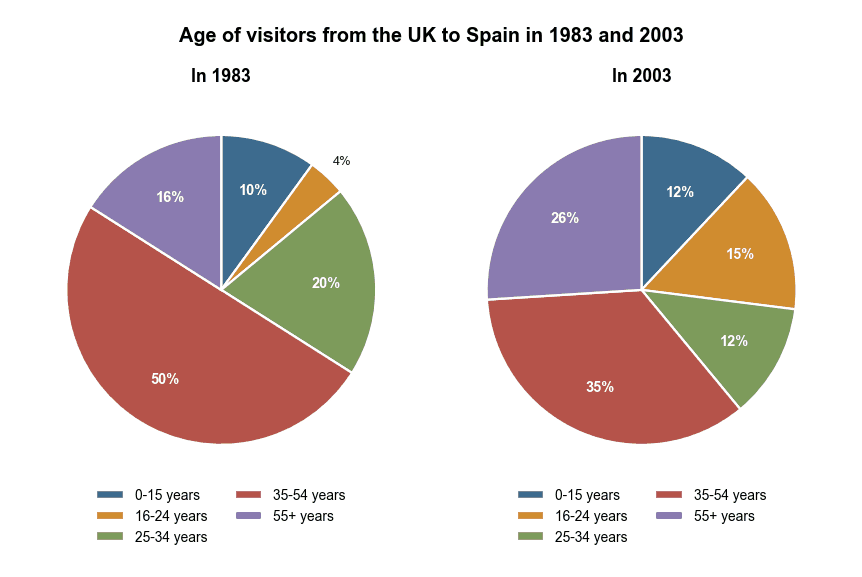
Age of UK Visitors to Spain, 1983 and 2003
The charts below give information about the age of visitors from the UK to Spain in 1983 and in 2003. Summarise the information by selecting and reporting the main features, and make comparisons where relevant.
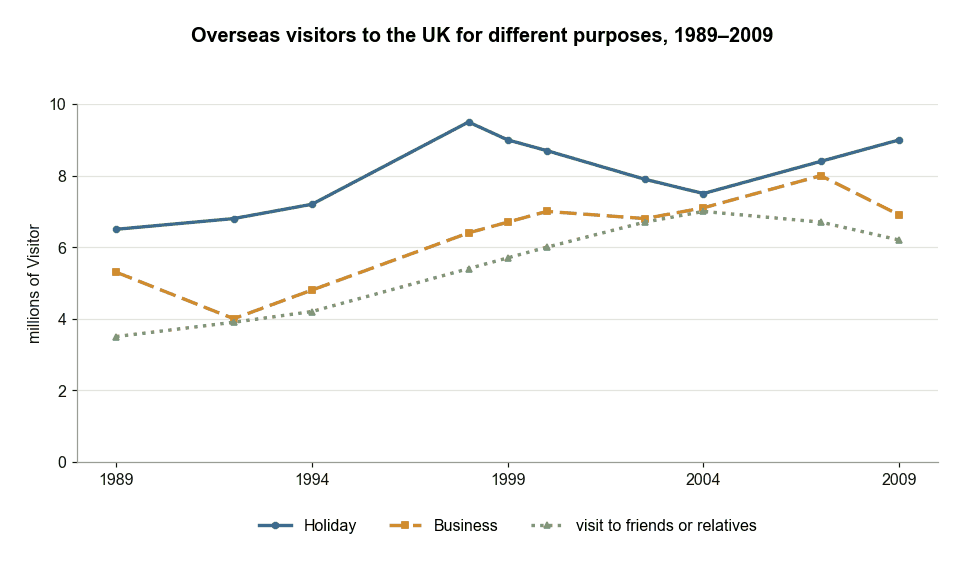
Overseas Visitors to the UK by Purpose
The line graph shows the number of overseas visitors who came to the UK for different purposes between 1989 and 2009. Summarise the information by selecting and reporting the main features, and make comparisons where relevant.
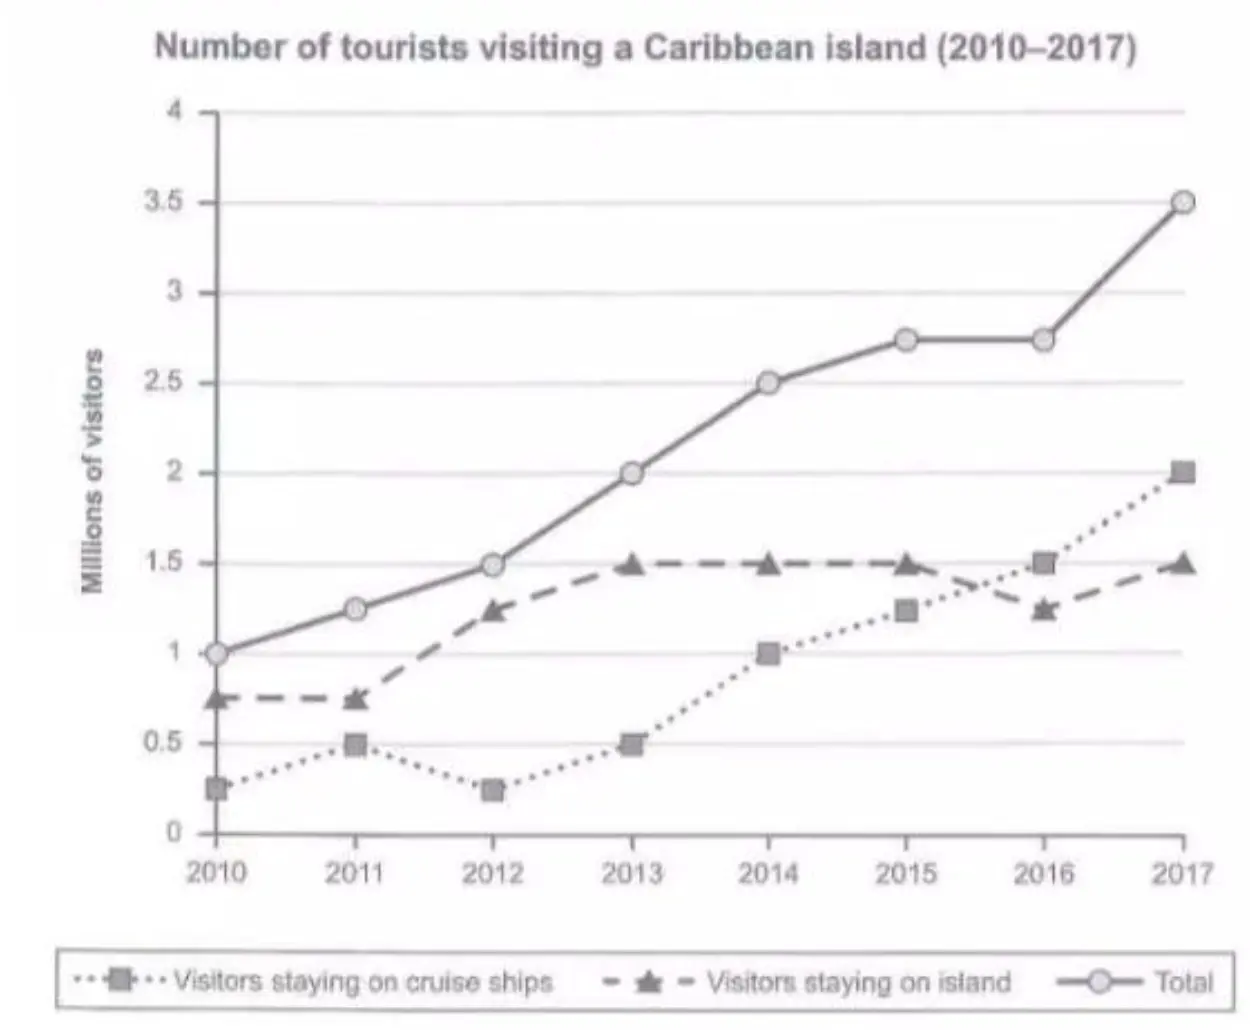
Caribbean Island Tourist Numbers (2010–2017)
The graph below shows the number of tourists visiting a particular Caribbean island between 2010 and 2017. Summarise the information by selecting and reporting the main features, and make comparisons where relevant.
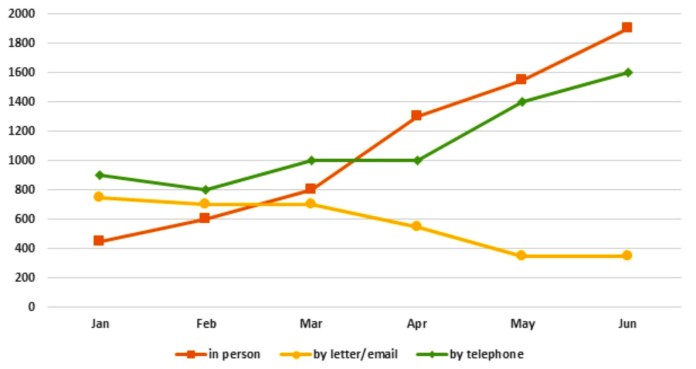
Tourist Information Office Enquiries in 2011
The graph below shows the number of enquiries received by the Tourist Information Office in one city over a six-month period in 2011.
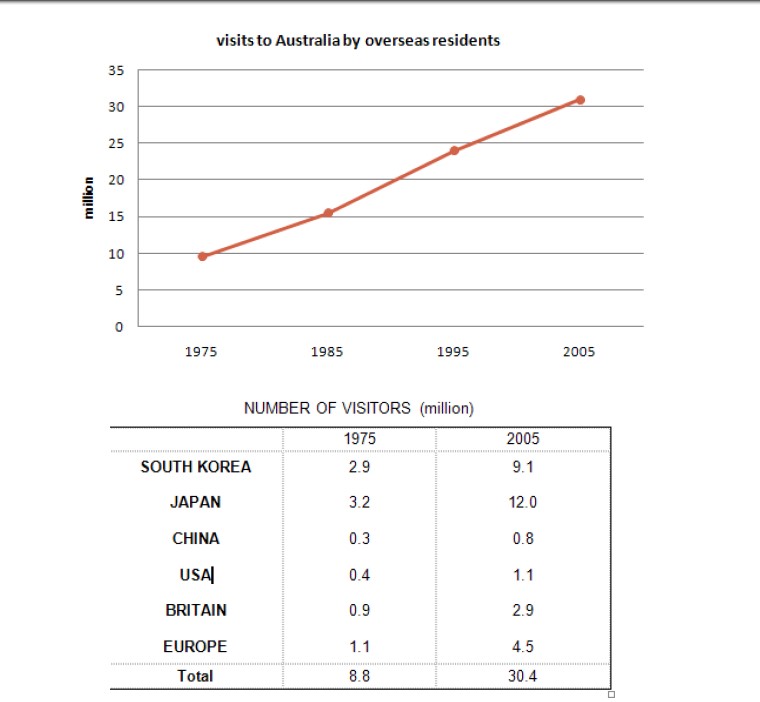
Annual Overseas Visitors to Australia
The line graph below shows the number of annual visits to Australia by overseas residents. The table below gives information on the country of origin where the visitors came from. NUMBER OF VISITORS (million) 1975 | 2005 SOUTH KOREA JAPAN CHINA USA BRITAIN EUROPE | 2.9 3.2 0.3 0.4 0.9 1.1 | 9.1 12.0 0.8 1.1 2.9 4.5 Total | 8.8 | 30.4
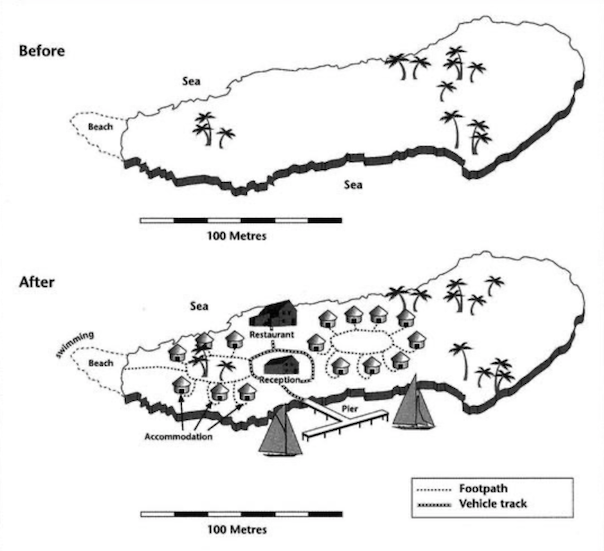
Island Tourist Facilities Before and After Development Map
The two maps below show an island, before and after the construction of some tourist facilities. Summarise the information by selecting and reporting the main features and make comparisons where relevant.