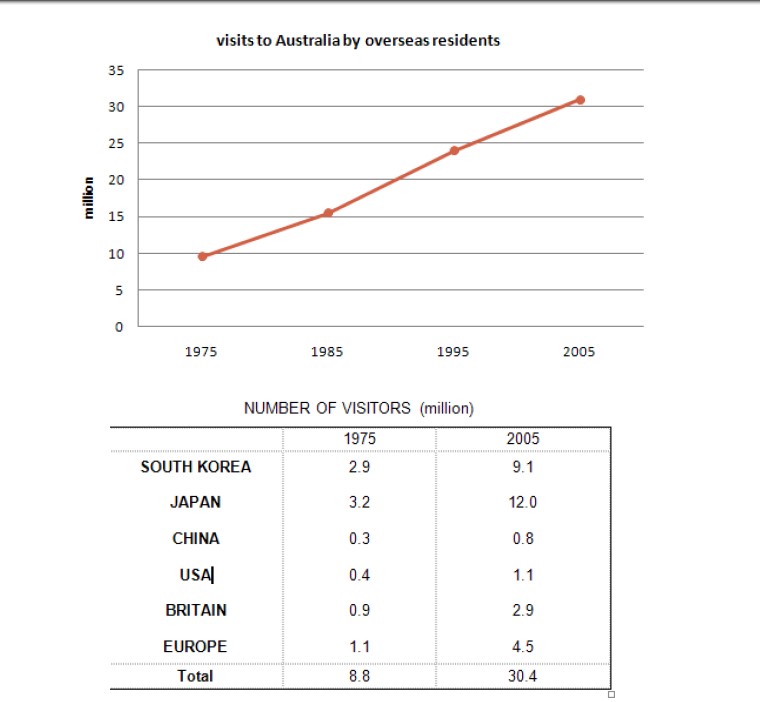
The line graph below shows the number of annual visits to Australia by overseas residents. The table below gives information on the country of origin where the visitors came from. NUMBER OF VISITORS (million) 1975 | 2005 SOUTH KOREA JAPAN CHINA USA BRITAIN EUROPE | 2.9 3.2 0.3 0.4 0.9 1.1 | 9.1 12.0 0.8 1.1 2.9 4.5 Total | 8.8 | 30.4
The line graph given depicts information about a yearly tour to Australia in 30years interval (1975 -2005) by residents of other countries while the table shows the data on the originality of the visitors. Overall, it can be seen that visits to Australia saw an upward trend in the number of visitors yearly likewise the table. Residents from Japan had the highest number of visitors in 1975 and 2005, whereas China had the least no of visits to Australia.
First, the number of visitors to Australia in 1975 stood at about 8million. Over the next 10 years, the number of visitors doubled. The visit to Australia saw an upward trend between 1985 to 1995. The number of people who travelled to Australia skyrocketed to almost a 25million in 1995. There was a steady rise in the number of people that travelled to Australia over the next decade where it hit a peak at just over 30 million visitors in 2005.
On the other hand, the table shows the six countries that visited Australia between 1975 and 2005. Japan had the highest number of visits to Australia between 1975 and 2005 at 3.2 million and 12 million respectively, followed by South Korea with the value of 2.9 million in 1975 and 9.1 million visitors in 2005. Europe, Britain, and the USA had a similar trend in ascending other in 1975 and 2005. However, China had the least number of visits to Australia. A total of 0.3 million Chinese took a tour to Australia in 1975, while 0.8 million Chinese residents visited Australia in 2005.
TA Task AchievementCC Coherence & CohesionLR Lexical ResourceGRA Grammatical Range & Accuracy
From essays on this question
Useful vocabulary
visited Australia
Meaning
Went to Australia and spent some time there.
From the essay
A total of 0.3 million Chinese took a tour to Australia in 1975, while 0.8 million Chinese residents visited Australia in 2005.