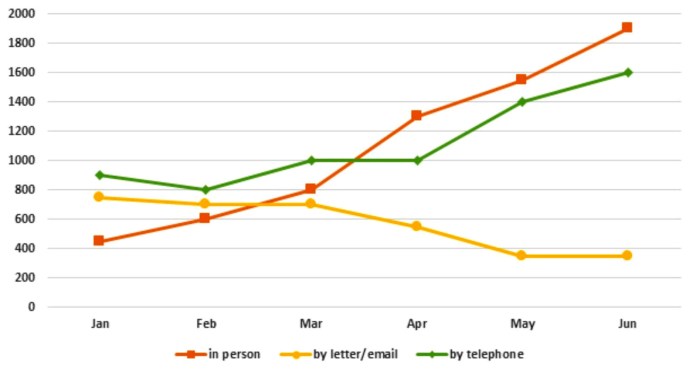
During the first six months of 2011, the line graph compares the number of questions received by one particular Tourist Information Office via three different channels: telephone, letter/email, and direct communication. Overall, the office received significantly more inquiries via phone and directly from tourists, as opposed to a gradually declining preference for mailing platforms over the time period provided.
Tourists called the office with about 900 questions, which was the highest number in January. This figure then fell by 100 in February and March before rising to 1000 in March and April, followed by a sharp increase to around 1600 inquiries in June. Similarly, the number of in-person inquiries increased the most, from 450 to 1900, making face-to-face communication the most common method of obtaining travel information.
The trend in written inquiries was the polar opposite. After remaining relatively stable at around 700 questions for the first three months, the number dropped to just 350 questions in May and June.
Estimated band7.0
7.0
7.0
7.0
7.0
Response 02
195 words
The line chart illustrates the number of inquiries sent to the Tourist Information Office in a particular city via three means of communication—telephone, letter/email, and in person—over a six-month period from January to June in 2011.
It is clear that in-person and telephone inquiries saw substantial increases, while written letters and emails became less common. Notably, inquiries made in person experienced the most dramatic growth.
In January, the Tourist Information Office received 900 telephone inquiries, while just under 800 letters and emails were received. Only around 400 tourists sought information in person. Over the next three months, the number of telephone inquiries remained steady, hovering at approximately 1000.
However, in-person inquiries rose sharply, reaching 800 by March, surpassing the figures for letters and emails. From March to June, in-person inquiries became the most common method, peaking at 1,900 in June, a significant increase of over 1,000 from January. Telephone inquiries also showed a notable rise, climbing from 1,000 to 1,600 by June. In contrast, the number of inquiries made via letter or email steadily declined, reaching just below 400 by May and June.
Overall, in-person and telephone inquiries grew significantly over the six months, while written methods of communication saw a marked decrease.
Estimated band7.5
7.5
7.5
7.5
7.5
Response 03
193 words
The line graph compares how many enquiries Tourist Information Officers in a city received in person, by letter/mail and by telephone from January to June 2011.
The initial impression from the chart is that the number of enquiries the Tourist Information Office received in person and by telephone saw upward trends, whilst that by letter showed an opposite pattern. It is also clear that enquiries in person had the fastest growth, surpassing the other two to become the prevalent mode.
During the first half of the period, the data on the by-telephone category topped the chart. The office received 900 calls for tourist information in January, which reached 1000 in March despite a marginal drop one month earlier. Meanwhile, the number of in-person queries doubled in March after starting from roughly 400. A downward trend, however, was recorded in the figure for the letter/email category, from nearly 800 to 700.
During the latter half of the period, the number of enquiries made in person soared to 1900 and outdid that through telephone calls, which ranked second with 300 questions fewer. By contrast, the figure for letters/emails hit a trough of under 400 in May and plateaued at the end.
Estimated band7.5
8.0
7.0
7.0
7.0
Response 04
177 words
The graph demonstrates the quantity of questions received by the Tourist Information Office in one city over the first half of the year 2011. Overall, the rate of enquiries received in person or by telephone each month increased over this period, whereas this figure decreased for enquiries received by letter or mail.
In January of 2011, it can be seen that enquiries in person were the fewest, at around 400 that month, compared to around 900 by telephone and 780 by letter or email. However, by June, while this number of enquiries for in person and by telephone has risen to 1900 and 1600 respectively, it has fallen to less than 400 by letter or mail.
It can also be seen that in person enquiries increased every month, surpassing enquiries by letter or email for the first time in March, and enquiries by telephone for the first time in April. Meanwhile, the number of enquiries by letter or email was uniformly lower than that by telephone across the period, with the gap between the two widening from around 100 in January to more than 1200 in June.
TA Task AchievementCC Coherence & CohesionLR Lexical ResourceGRA Grammatical Range & Accuracy
From essays on this question
Useful vocabulary
in person
Meaning
By being physically present, rather than calling or writing.
From the essay
Notably, inquiries made in person experienced the most dramatic growth.