Electrical Appliance Ownership and Housework Time

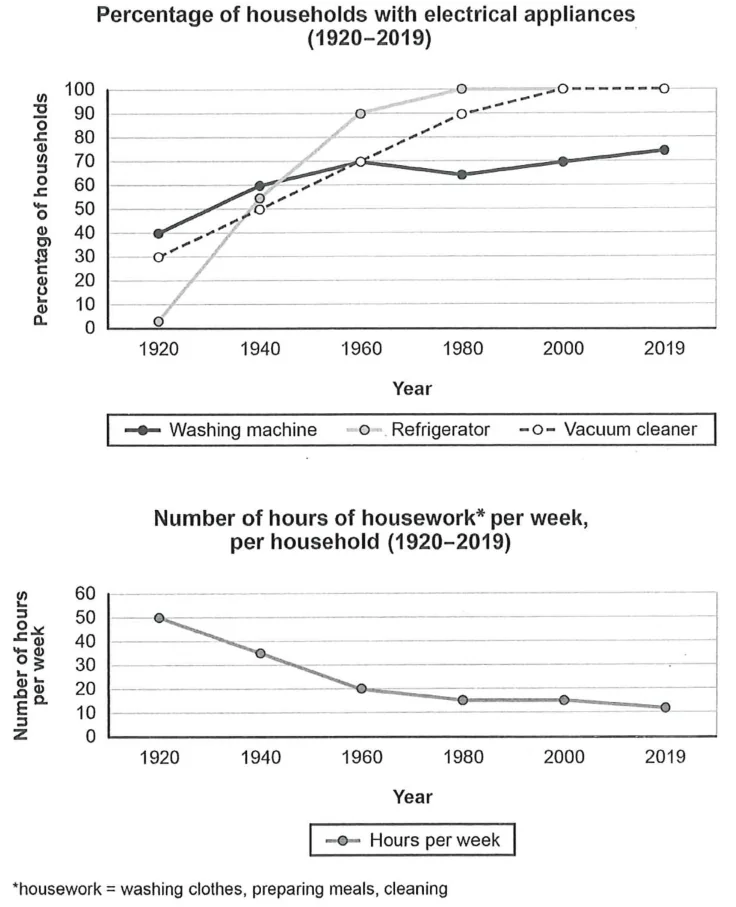
The charts below show the changes in ownership of electrical appliances and amount of time spent doing housework in households in one country between 1920 and 2019. Summarise the information by selecting and reporting the main features, and make comparisons where relevant.

Cambridge IELTS 16 Academic Test 1 Writing Task 1 visual

Annotated response

9 correction notes

Showing 9 correction notes.

The line graphs illustrate the evolving patterns of household electrical appliance ownership and the corresponding time dedicated to housework in from 1920 to 2019.

In general, there was a noticeable surge in the ownership of various electrical appliances throughout the period, which directly correlates with a dramatic reduction in the average number of hours spent on household chores.

In 1920, 30% of households owned vacuum cleaners and 40% washing machines. However, ownership began to rise steadily , with refrigerators and vacuum cleaners experiencing the most significant growth. By 1960, approximately 90% of households possessed a refrigerator, a figure that reached virtually 100% by 1980. Similarly, vacuum cleaner ownership soared from about 30% in 1920 to over 90% by 1980, achieving near-universal penetration by 2019. The washing machine also saw a substantial increase, .

the average weekly hours spent on housework witnessed a steep decline. Starting at a considerable 50 hours per week in 1920, this figure plummeted to . The downward trend continued, with housework hours stabilising at 10 hours per week by 2019,

Overall assessment

Why this response received Band 7.5

The response covers all key features of both charts with a clear overview and fluent, well-linked description. Its main limitation is several data inaccuracies relative to the charts, such as the housework figure of about 30 hours by 1960 (the chart shows roughly 20) and the washing machine reaching around 70% by 1970, a year not plotted.

IELTS criteria

How each score was decided

Task Achievement

7.0

The response presents a clear overview of rising appliance ownership linked to declining housework hours and covers all three appliances and both charts, but several quoted figures deviate from the chart, including housework at about 30 hours by 1960 and washing machine ownership around 70% by 1970.

Coherence and Cohesion

7.0

The information is logically sequenced from introduction through overview to detailed paragraphs, with cohesive devices such as 'similarly' and 'concomitantly' used naturally to link trends.

Lexical Resource

8.0

The response uses a wide and precise range of trend vocabulary, including 'soared', 'plummeted', 'near-universal penetration', and 'stabilising', with only minor natural collocational slips.

Grammatical Range and Accuracy

7.0

A variety of complex structures, including participle clauses, relative-style framing, and 'with' constructions, is handled flexibly with generally good accuracy and only occasional minor imperfections.