Electrical Appliance Ownership and Housework Time

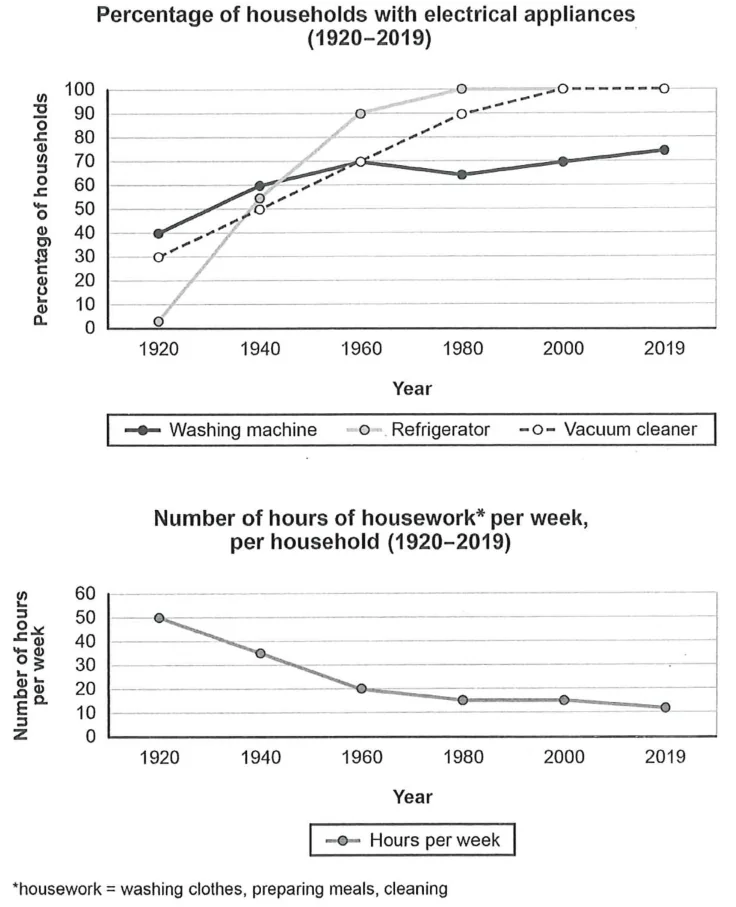
The charts below show the changes in ownership of electrical appliances and amount of time spent doing housework in households in one country between 1920 and 2019. Summarise the information by selecting and reporting the main features, and make comparisons where relevant.

Cambridge IELTS 16 Academic Test 1 Writing Task 1 visual

Annotated response

3 correction notes

Showing 3 correction notes.

The first line graph illustrates how the rate of electrical appliance ownership changed from 1920 to 2019 in a country, while the second graph displays the time spent on housework weekly during the same period. It can be seen that the percentage of families with washing machines, fridges and vacuum cleaners experienced an upward trend, whereas the amount of time doing housework underwent a decline.

In 1920, the rate of washing machine ownership was the highest, with 40%, followed by that of vacuum cleaners, with 30%, while barely any household owned refrigerators. Over the next years, the proportion of families with fridges surged, being the first to reach 100% in 1980. The share of households that possessed vacuums hit 100% in 2000 and remained at this level afterward, whereas the data for washing machines fluctuated during the 100-year period and finished at about 75% by 2019. This made the rate of washing machine ownership the lowest in the final year.

With regard to time spent doing housework, it started at the highest point of 50 hours per week in 1920. This figure fell in the following years, with the most noticeable decline happening between 1920 and 1960, as it dropped to 20. This trend much more mildly over the final 60 years, as after a period of relative stability from 1980 to 2000, the amount of time for housework finished at over 10 hours a week per household.

Overall assessment

Why this response received Band 7.5

The response covers both charts accurately and thoroughly, with a clear overview, precise data selection, and effective comparisons between the appliance trends. Its main limitation is a small number of language slips, such as the spelling of 'occurred' and occasional awkward phrasing, alongside generally sound but not fully flexible sentence construction.

IELTS criteria

How each score was decided

Task Achievement

8.0

The response gives a clear overview of rising appliance ownership and falling housework time, and reports key figures accurately, including fridges reaching 100% in 1980, vacuum cleaners in 2000, and the decline in hours from 50 to about 10, with well-chosen comparisons and no invented data.

Coherence and Cohesion

7.5

Ideas progress logically across well-managed paragraphs with effective linking devices such as 'whereas', 'over the next years' and 'with regard to', though cohesion is occasionally mechanical in the data sequences.

Lexical Resource

7.5

Vocabulary is flexible and appropriate for describing trends, including 'surged', 'fluctuated' and 'underwent a decline', with only a minor slip ('occured') and some slightly repetitive percentage phrasing.

Grammatical Range and Accuracy

7.5

A good range of structures is used, including participial and relative clauses and accurate tense control, with rare errors that do not impede understanding.