Electrical Appliance Ownership and Housework Time

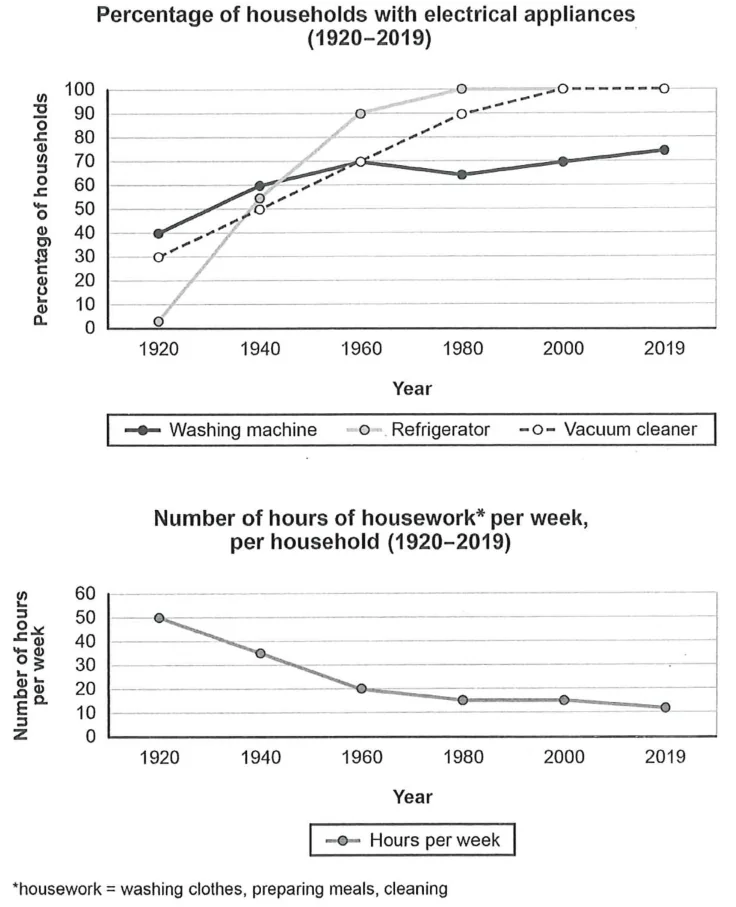
The charts below show the changes in ownership of electrical appliances and amount of time spent doing housework in households in one country between 1920 and 2019. Summarise the information by selecting and reporting the main features, and make comparisons where relevant.

Cambridge IELTS 16 Academic Test 1 Writing Task 1 visual

Annotated response

7 correction notes

Showing 7 correction notes.

The first line graph outlines how electrical appliance ownership in households in a country changed during a century, commencing from 1920. The second chart delineates how it the time spent on household work per week by the citizens in this country.

As a general trend, with the increasing number of electrical devices possessed by families, their need for doing housework significantly declined.

As the graph reveals, only 30 percent of households in this country had vacuum cleaners and four out of ten families had washing machines in 1920. Refrigerators were a rare electrical appliance at that time. Just after two decades, however, shot up, and almost half of the families owned these three electrical items in their homes. More families started to own such devices and at the beginning of the twenty-first century, almost all households had fridges and vacuum cleaners. The washing machine was owned by more than 70% of families which slowly but steadily increased till 2019. At that point, there was hardly any family without a refrigerator or vacuum cleaner.

with the increasing number of families owning those electrical appliances, their need for doing household work like preparing meals, cleaning and washing clothes remarkably diminished. While they used to work for 50 hours a week doing such work in 1920, it decreased to 20 hours in 1960

Overall assessment

Why this response received Band 7.0

The response covers both charts, presents a clear overview linking appliance ownership to declining housework hours, and reports mostly accurate data with relevant comparisons. The main limitations are minor data inaccuracies, such as overlooking the dip in washing machine ownership around 1980 and slight imprecision about the 1940 figures, alongside occasional grammatical awkwardness.

IELTS criteria

How each score was decided

Task Achievement

7.0

The response covers both charts, gives a clear overview of the inverse relationship between appliance ownership and housework time, and reports most key figures accurately, though some details are imprecise, such as the 1940 ownership levels and the dip in washing machine ownership around 1980.

Coherence and Cohesion

7.0

Ideas are logically organised with clear paragraphing, effective referencing, and a range of cohesive devices used naturally, with only occasional slight mechanical linking such as the abrupt opening of the final paragraph.

Lexical Resource

7.0

Vocabulary is sufficiently flexible and precise for the task, with good use of terms like shot up, remarkably diminished, and steadily increased, and only minor wordiness or slightly imprecise phrasing.

Grammatical Range and Accuracy

7.0

A variety of complex structures is used with generally good control, including relative clauses and time expressions, though occasional errors such as how it had affected and inconsistent number agreement reduce precision slightly.