Electrical Appliance Ownership and Housework Time

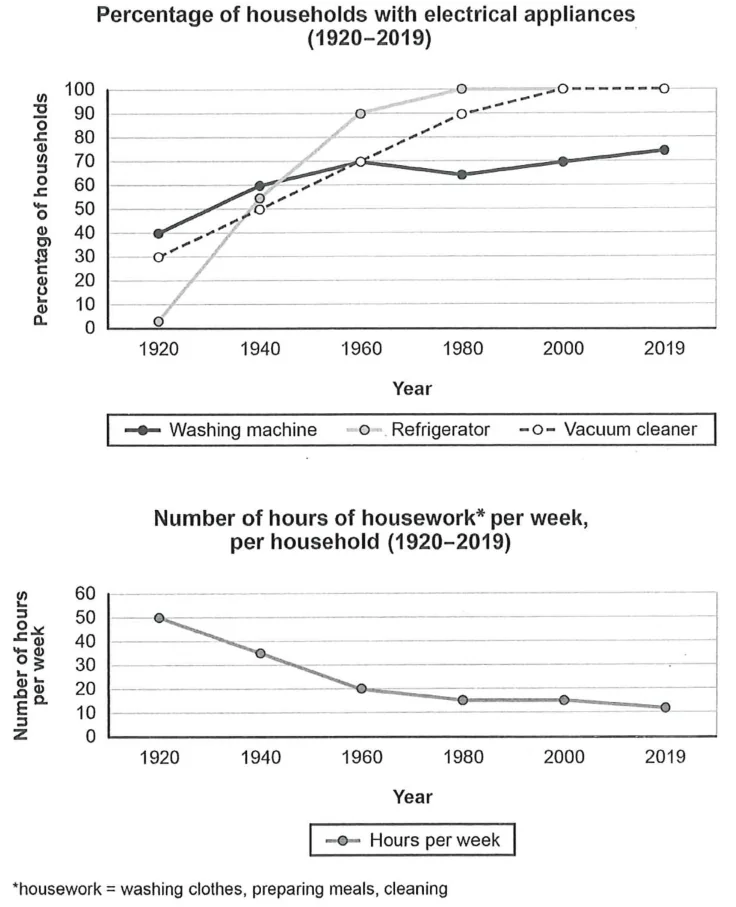
The charts below show the changes in ownership of electrical appliances and amount of time spent doing housework in households in one country between 1920 and 2019. Summarise the information by selecting and reporting the main features, and make comparisons where relevant.

Cambridge IELTS 16 Academic Test 1 Writing Task 1 visual

Annotated response

8 correction notes

Showing 8 correction notes.

The first line graph illustrates the percentage of households that owned electrical washing machines, refrigerators, and in one country. The second graph shows the number of hours spent per week on housework per household during the same period.

Overall, ownership of all three appliances increased over time, with refrigerators and vacuum cleaners experiencing the most dramatic growth, eventually reaching near-universal adoption. Conversely, the average weekly hours spent on housework declined steadily, which shows that increased access to electrical appliances is strongly associated with a marked reduction in household labour over the past century.

In 1920, refrigerators had insignificant ownership of households owned vacuum cleaners and 40% had washing machines. refrigerator ownership rose sharply, surpassing 90% by 1960 and reaching 100% by 1980. Vacuum cleaner ownership followed a similar trajectory, hitting 100% by 2000. Washing machine ownership grew gradually, climbing to about 70% by 1960 and approximately 75% by 2019.

on housework decreased significantly from 50 hours per week in 1920 to roughly 15 hours in 1980 before levelling off at around 10 hours by 2019. This trend appears inversely related to the growing adoption of household appliances.

Overall assessment

Why this response received Band 8.0

The strongest aspect is the accurate and well-selected coverage of both visuals, with a clear overview linking appliance ownership to declining housework hours and mostly correct data. The main limitation is a slight tendency toward interpretive commentary and one or two imprecise figures, alongside language that is strong but not uniformly flexible.

IELTS criteria

How each score was decided

Task Achievement

8.0

The response covers all key features of both charts with an accurate overview, well-chosen comparisons, and mostly correct data, though a few figures are slightly overstated and minor detail is compressed.

Coherence and Cohesion

7.5

Ideas progress logically across clear paragraphing with effective cohesive devices, although some linking of trends leans on interpretive comment rather than pure reporting.

Lexical Resource

7.5

Vocabulary is flexible and precise, with natural phrases such as near-universal adoption, followed a similar trajectory, and levelling off, with only occasional less precise wording.

Grammatical Range and Accuracy

8.0

A wide range of structures is used with strong control, including complex participle and relative clauses, and errors are rare and non-impeding.