
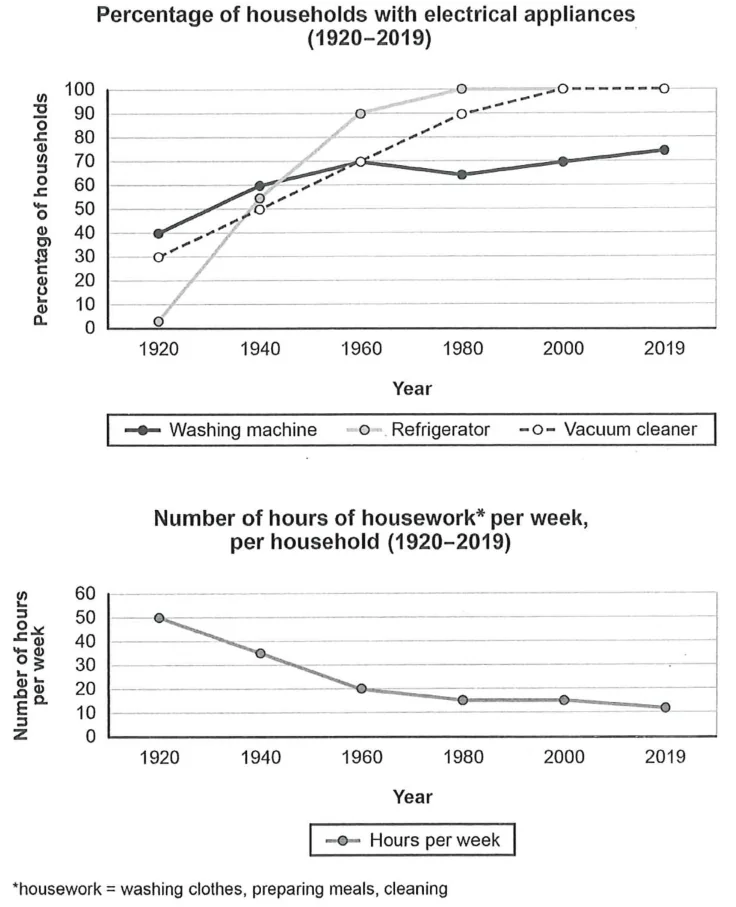
The first line chart illustrates the proportions of households owning washing machines, refrigerators and vacuum cleaners while the second one depicts how much time per week on household chores from 1920 to 2019 in one particular nation.
Overall, it is notable that while the figures for witnessed a strong surge, the opposite was true for . In addition, refrigerators and vacuums gained substantial popularity, making them the most common at the end of the period.
Upon a closer look at appliance ownership, in 1920, the percentages of homes having refrigerators and vacuums were nearly 3% and 30%, respectively. During the next ten decades, the former skyrocketed to its peak of 100% in 1980, followed by a plateau, whereas the latter soared to 100% in 2000, then remained unchanged. As for washing machines, ownership was much higher than the others initially, at 40%. However, it experienced a slower growth to just 70% between 1920 and 1960, but later in 1980 and recovered steadily to approximately 75% by 2019.
Turning to the figures for hours spent on housework weekly, a plunge from 50 to 15 was seen over the first 60 years, and it then marginally declined to 10 hours by 2019.