Recent exam · 9 Aug 2026Recycled · 2020More recent exam questions

Waste Collection by a Recycling Centre (2011–2015)

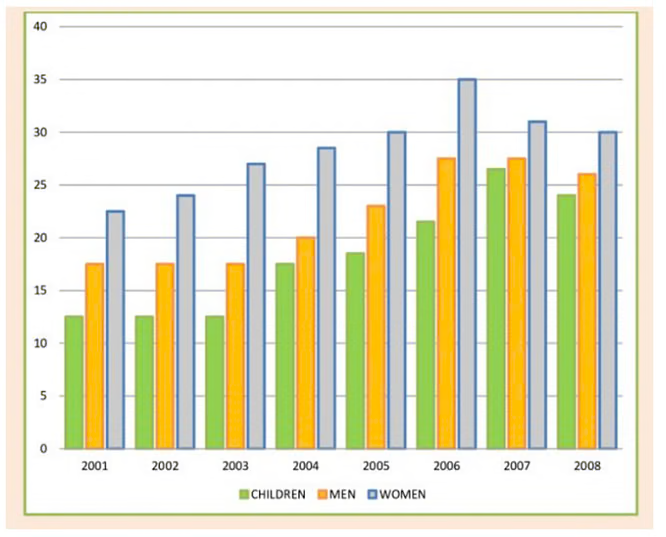
The chart below shows waste collection by a recycling centre from 2011 to 2015.

Summarise the information by selecting and reporting the main features, and make comparisons where relevant.

3 sample answers, estimated Band 7.0–7.5. Your turn?

Write it first, then read the sample answers and reviews below. You'll see the gap at once.

  • Question and chart ready
  • 20-minute exam timer
  • Results in about 20 seconds
  • 1 free preview a week

From essays on this question

Key features: Waste Collection by a Recycling Centre (2011–2015)

WhyThis is aBar chart — it asks you to compare the most important categories.

SoWe split the points intoOverview(the biggest differences or patterns)andKey features(figures and comparisons worth reporting).

Overview

3 points

Key features

6 points

Same question · Different responses

Sample responses and feedback

Response 01

Must fixSuggested

Answer · 156 words · 4 paragraphs · 8 comments

Score details

Response 01
Estimated band7.0/ 9

Overall assessment

The response presents a clear sequence from overview to supporting figures and identifies paper’s 2013 low. However, the overview understates the variation in total collection, which fell sharply in 2012 before rising to a peak in 2015. Garden waste is also mislabeled as plastic in the 2011 account, and the 2015 paper figure is exactly 70 tons. More precise overview wording and a specific comparison of the other materials would strengthen the report.

TA

Task Achievement

The response reports useful opening and closing figures and the paper low in 2013, but its overview incorrectly describes the yearly totals as fluctuating only slightly. It also mislabels garden waste as plastic in 2011 and puts the labelled 2015 paper value above 70 tons. The 2013 exception to paper’s usual lead would sharpen the overview.

7.0
CC

Coherence and Cohesion

Ideas progress logically from an overview to detailed year-based descriptions, with cohesive devices such as 'meanwhile' and 'while' used naturally and without strain.

7.0
LR

Lexical Resource

Vocabulary is sufficiently flexible for the task, with terms like 'fluctuated', 'hit the lowest point' and 'the opposite was true for', though occasional imprecise collocations such as figures 'witnessing' fluctuations appear.

7.0
GRA

Grammatical Range and Accuracy

The response uses subordinate clauses and a with-construction to combine figures, with generally controlled past-tense reporting. The existential wording in the 2011 tin sentence is cumbersome and could be made clearer with a direct passive construction.

7.0

What to work on next

Check the overview against the chart: total collection fell sharply in 2012, then rose to a 2015 peak. Verify category labels and endpoints, especially garden waste in 2011 and paper at 70 tons in 2015.

From essays on this question

Useful vocabulary: Waste Collection by a Recycling Centre (2011–2015)

From essays on this question

Sentence patterns: Waste Collection by a Recycling Centre (2011–2015)

Practise this question

Write your response

Task 1 Academic question loaded.
Part 1

You should spend about 20 minutes on this task. Write at least 150 words.

Words: 020:00 starts on first word