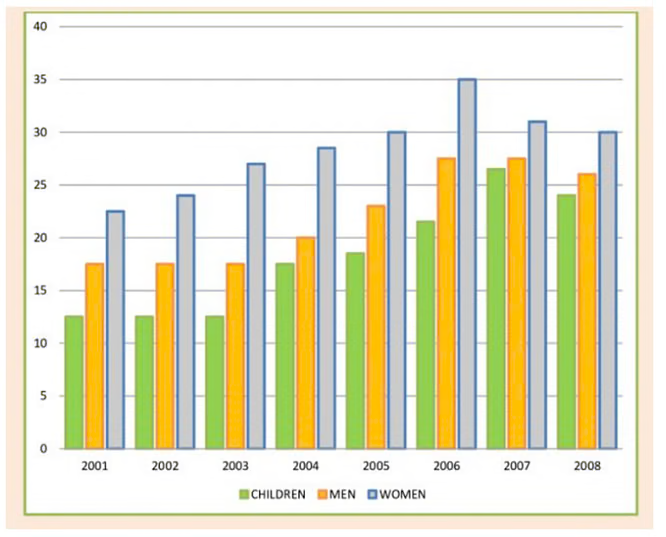
The given graph shows the proportion of the UK population following the dietary recommendation of consuming fruit and vegetables five times daily from 2001 to 2008.
Overall, there was an increase observed across the UK during the mentioned period, with a notable gap in the growth rates among children, men, and women.
Initially, the percentage of children meeting the dietary guideline stood at approximately 12% in 2001, maintaining a steady state until 2003 before experiencing a consistent rise, peaking at around 25% in 2007. Similarly, the proportion of men was roughly at 17% in the year 2001, showing lesser change in the amount in the next two years. Then, the percentage of men had a sharp increase of around 27% by 2007.
On the other hand, the percentage of women who the mentioned proportions of fruits and vegetables a day in 2001 was the highest among the said categories. Over the period from 2001 to 2006, there was a gradual increase in their numbers, rising from around 21% to 34%, and experiencing a slight decline of nearly 3% in the final two years. Anyways, women remained as the highest population in 2008 compared to men and children.
Estimated band7.0
6.5
7.0
7.0
7.0
Response 02
165 words
The presented graph highlights the proportion of the UK population consuming fruits and vegetables five times a day as a routine from 2001 to 2008.
Overall, there was a consistent upward increase across all the demographics, with notable increases for children and men, and a more moderate rise for women in the UK.
First off, children had the lowest percentage, starting at approximately 12% in 2001 and maintaining stability in the numbers until the year 2003, then steadily increasing to around 25% by 2007. Similarly, men experienced a similar trend, starting at about 17% in 2001, remaining unchanged for the next two years, before facing a sudden incline to nearly 27% by the year 2007. However, both groups witnessed a gradual decline in the final year, 2008.
In contrast, women began with the highest percentage in 2001, around 21%. Moreover, this gradually increased to about 34% by the year 2006. But, eventually, the numbers then dropped by almost 3% in the last two years. Despite all of this, the population of women remained at the top in the UK by the year 2008.
Estimated band7.0
6.5
7.0
7.0
7.0
Response 03
160 words
The bar chart shows the proportion of men, women, and children in the UK consuming five portions of fruits and vegetables daily between 2001 and 2008.
Overall, there is a notable increase in this kind of food consumption across all the mentioned groups, followed by a gradual decline towards the end.
To begin with, in general, there was an upward trend in consumption for all categories throughout the entire period. Notably, children and men experienced significant increases, while women showed a more moderate rise. The proportion of women consuming fruits and vegetables started at 21% in 2001 and steadily peaked at 35% in 2006 before declining to 30% by the year 2008.
On the other hand, children’s fruit and vegetable consumption in the UK rose from 12% in 2001 and reached up to 27% in 2007, with a slight decline to 25% in 2008. Similarly, the men of the UK consumed the mentioned diet at a stagnant percentage of around 12% for the first three years (2001-2003), gradually increasing to 27% by 2007 before a slight decrease thereafter.
TA Task AchievementCC Coherence & CohesionLR Lexical ResourceGRA Grammatical Range & Accuracy
From essays on this question
Useful vocabulary
five portions
Meaning
Five servings of food, each a usual amount for one person.
From the essay
The bar chart shows the proportion of men, women, and children in the UK consuming five portions of fruits and vegetables daily between 2001 and 2008.