
IELTS Academic Writing Task 1Topic
Recycling
Bar chart
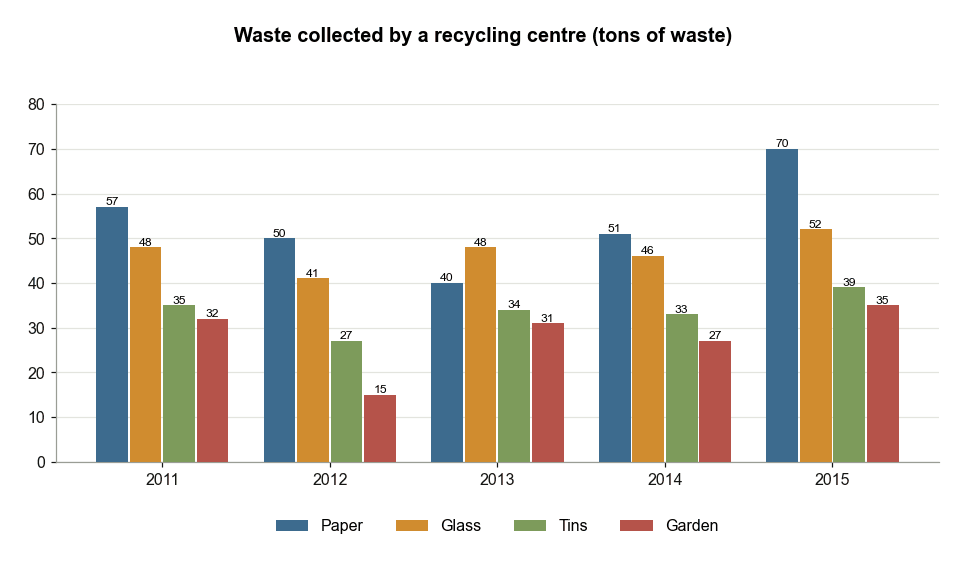
Waste Collection by a Recycling Centre (2011–2015)
The chart below shows waste collection by a recycling centre from 2011 to 2015. Summarise the information by selecting and reporting the main features, and make comparisons where relevant.
Bar chart
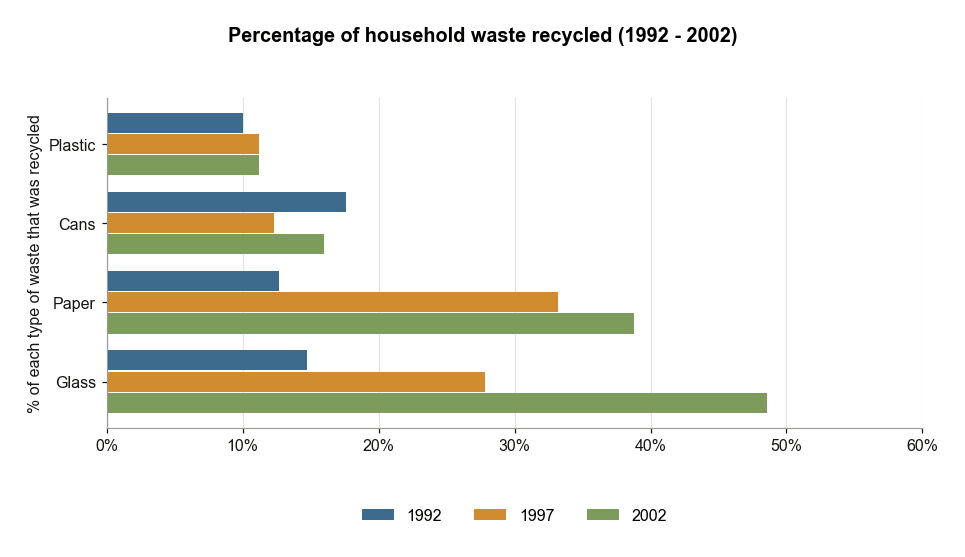
Household Waste Recycled in One City 1992-2002
The chart below shows the percentage of different types of household waste that were recycled in one city between 1992 and 2002. Summarise the information by selecting and reporting the main features, and make comparisons where relevant.
Process
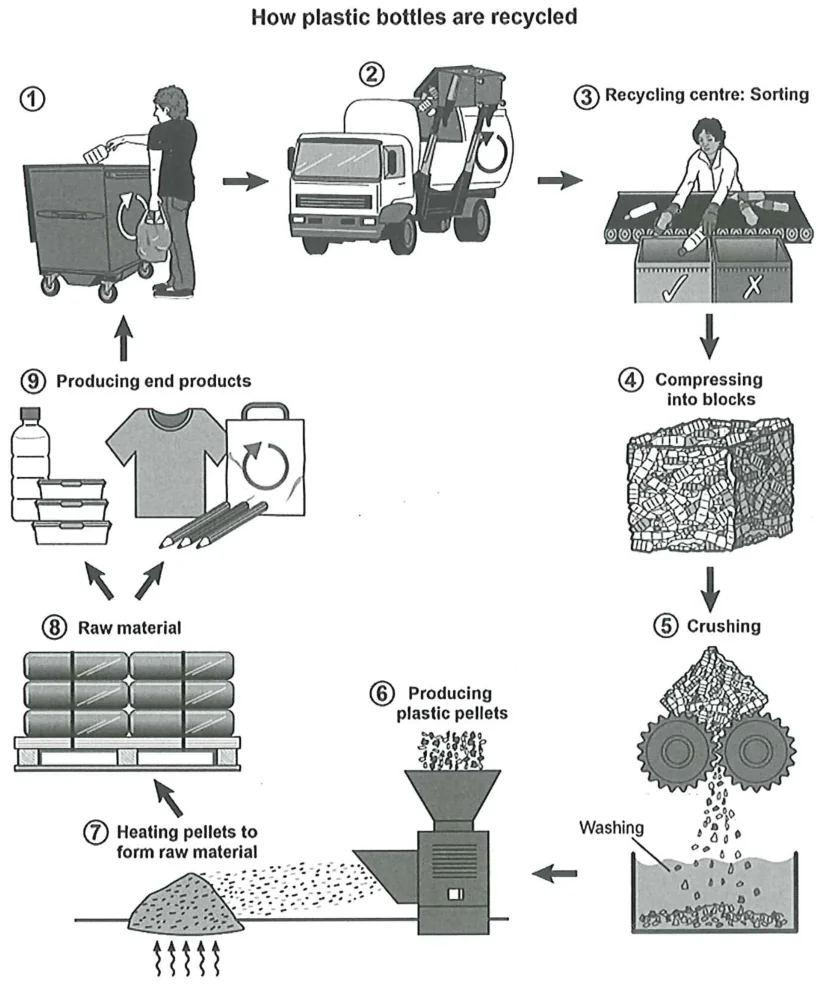
Plastic Bottle Recycling Process Diagram
The diagram below shows the process for recycling plastic bottles. Summarise the information by selecting and reporting the main features, and make comparisons where relevant.