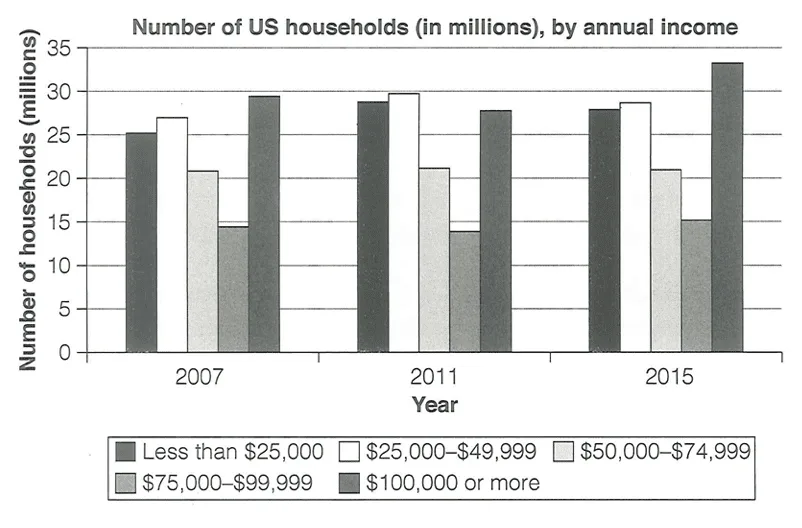
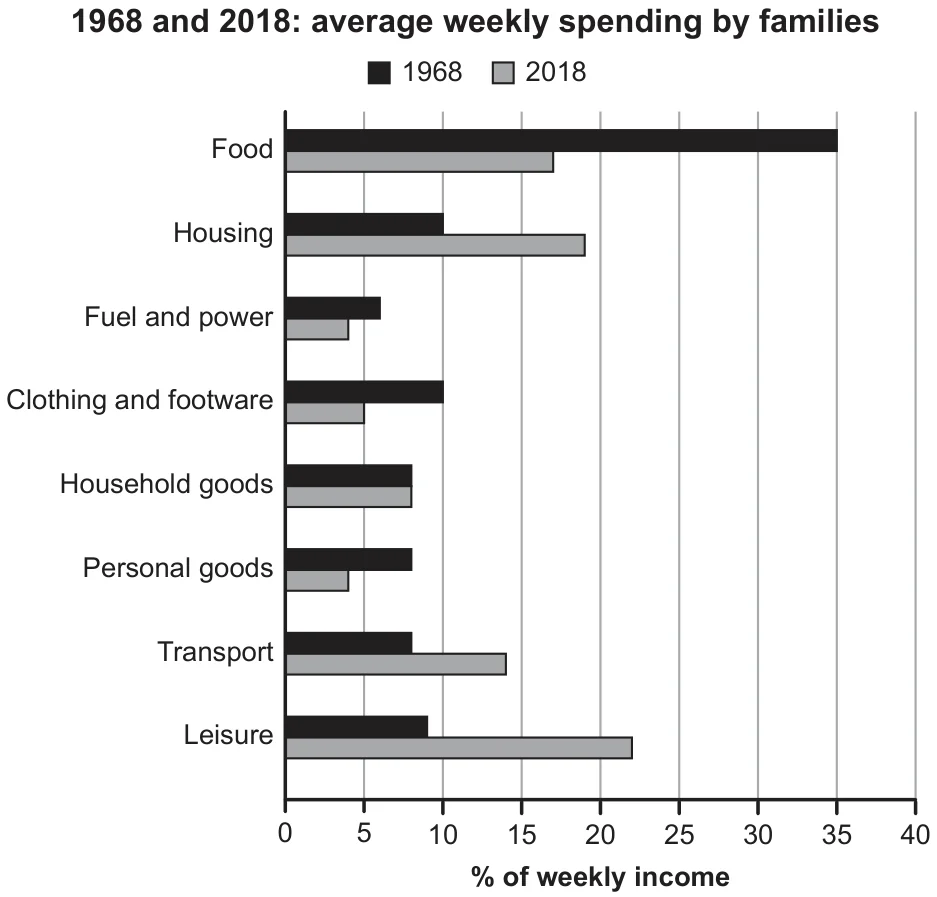
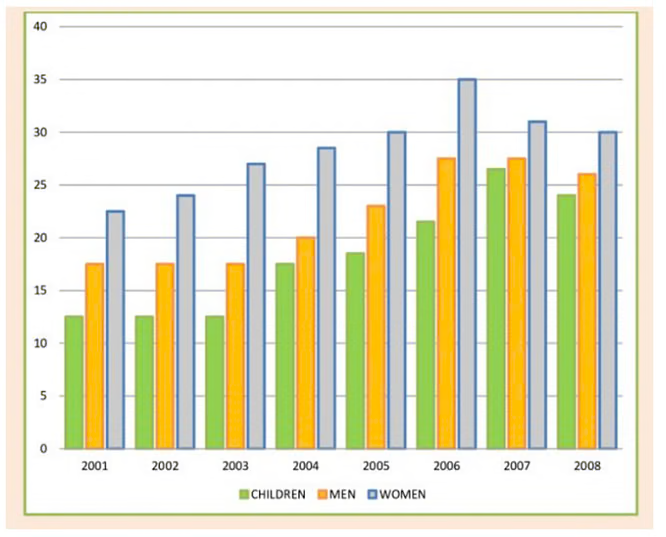
The response covers both charts and identifies the highest and lowest regions, but the overview remains vague and the middle regions lack supporting figures. Europe’s male higher-education rate is reported as 55% rather than about 60%; the final under-25% comparison also needs a clearer regional reference.
6.0The response follows an introduction, overview and separate discussions of the two charts, with line breaks marking these stages. However, links between statements are often mechanical, and repeated general statements about high or low numbers add little development. The final sentence also leaves the scope of its percentage comparison unclear.
6.0Vocabulary conveys the main comparisons but is limited and repetitive, especially numbers, places, and high or low. Expressions such as “women is bigger” and “even lesser” are imprecise or unnatural for participation rates, while “Europe is the best” introduces an unsupported judgement about quality.
5.0GRAGrammatical Range and Accuracy
Sentence forms are mostly simple and errors are frequent, particularly persistent subject-verb agreement mistakes such as the charts is showing, both genders is, and boys is about 30%, though meaning generally remains understandable.
5.0