
IELTS Academic Writing Task 1Topic
Sales
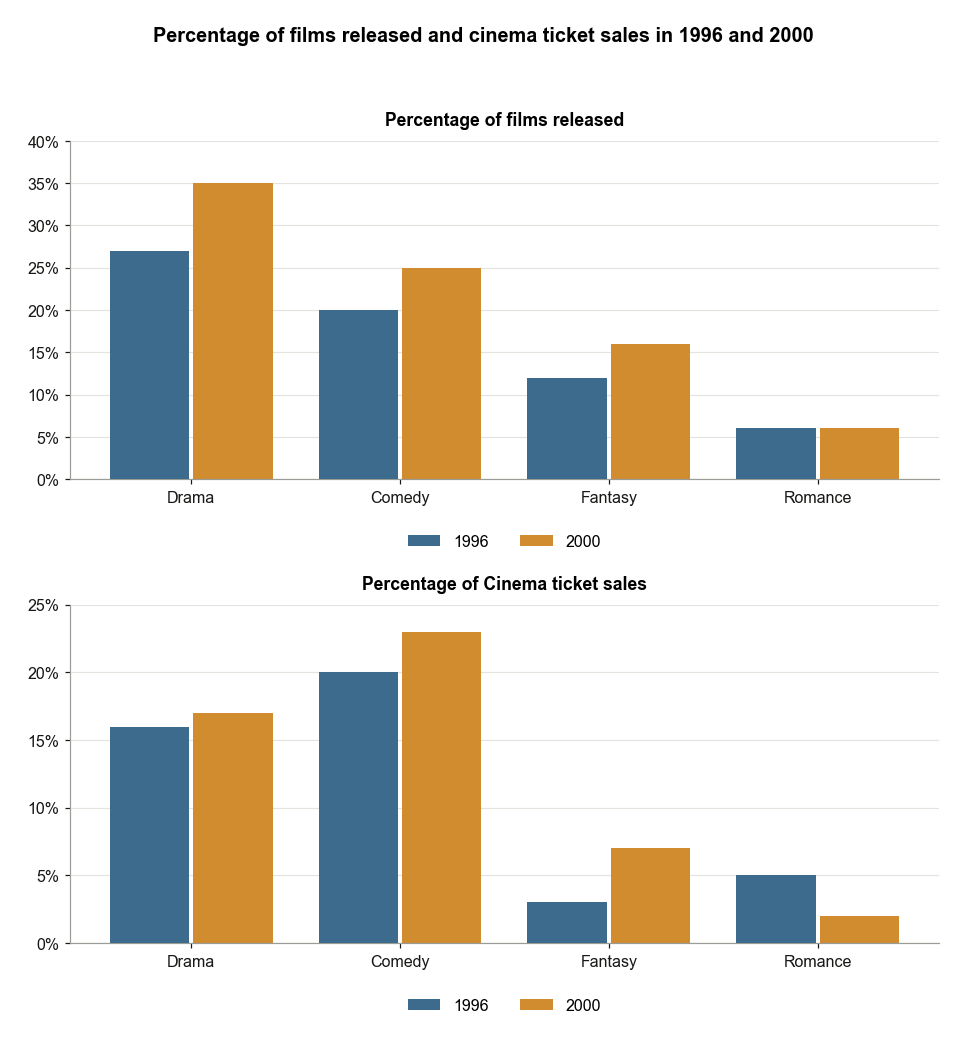
Films Released and Ticket Sales in 1996 and 2000
The graphs below show the total percentage of films released and the total percentage of ticket sales in 1996 and 2000 in a country. Summarise the information by selecting and reporting the main features, and make comparisons where relevant.
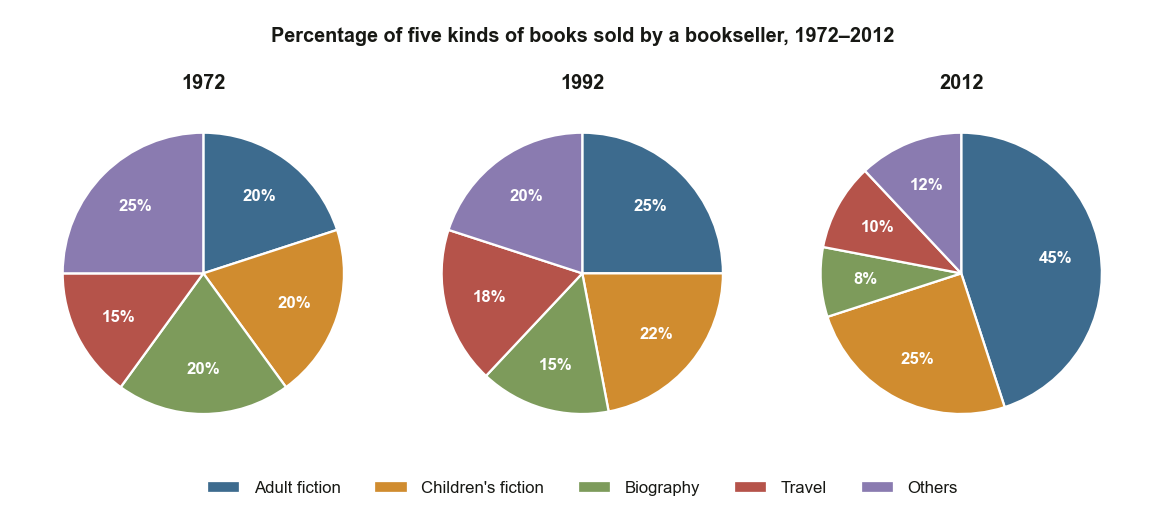
Book Sales by Genre Between 1972 and 2012
The pie charts below show the percentage of five kinds of books sold by a bookseller between 1972 and 2012. Summarise the information by selecting and reporting the main features, and make comparisons where relevant.
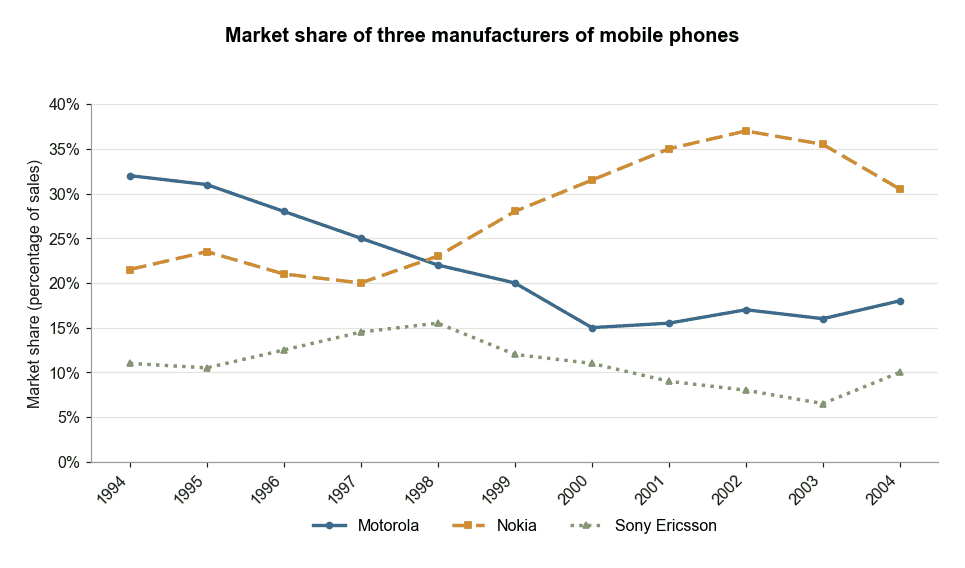
Mobile Phone Sales by Three Manufacturers 1994–2004
The line graph below illustrates the proportion of mobile phone sales by three manufacturers (Motorola, Nokia and Sony Ericsson) between 1994 and 2004. Summarise the information by selecting and reporting the main features, and make comparisons where relevant.
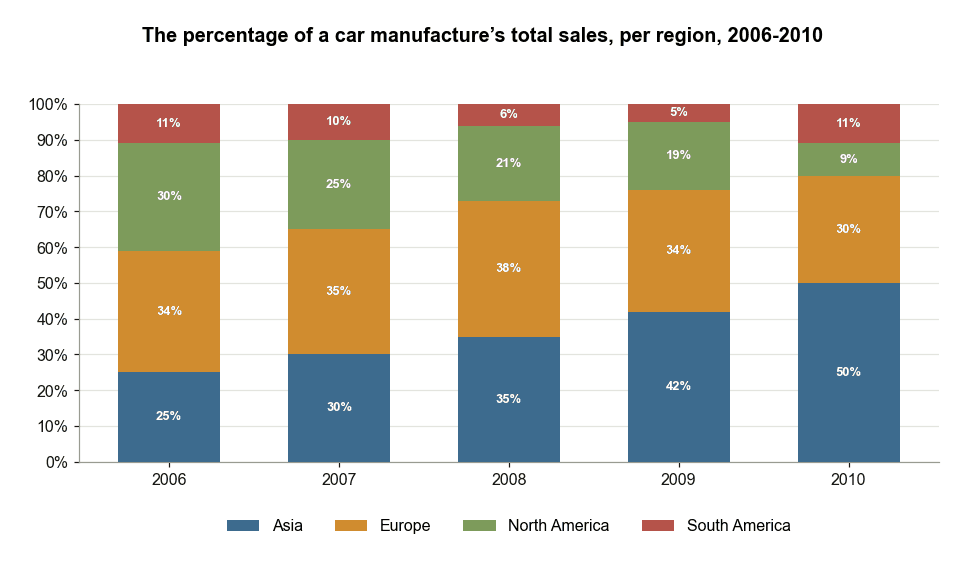
Car Manufacturer Sales by Region 2006 to 2010
The chart below shows the percentage of a car manufacturer’s total sales in various regions from 2006 to 2010. Summarise the information by selecting and reporting the main features, and make comparisons where relevant.
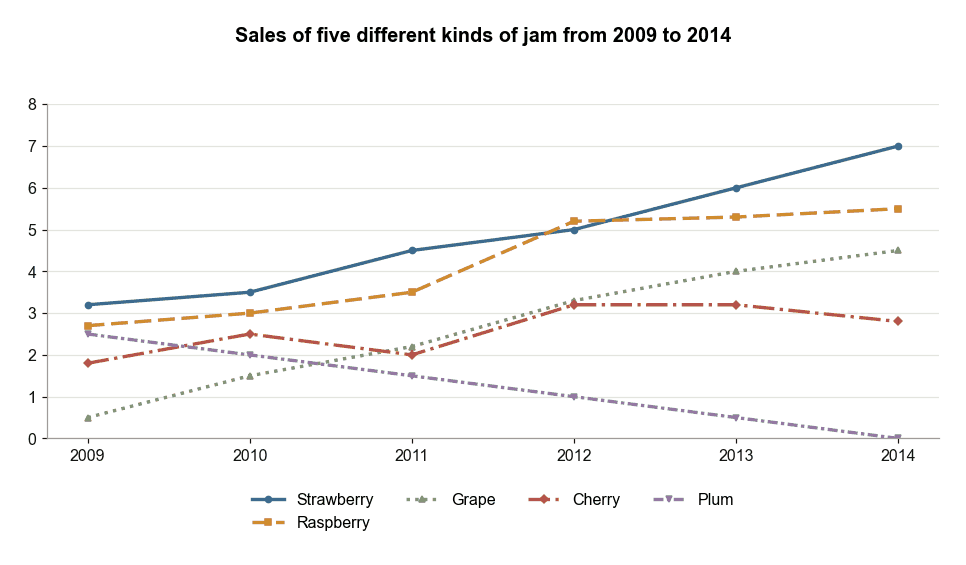
Sales of Five Different Kinds of Jam
The chart shows the sales of five different kinds of jam from 2009 to 2014. Summarise the information by selecting and reporting the main features, and make comparisons where relevant.
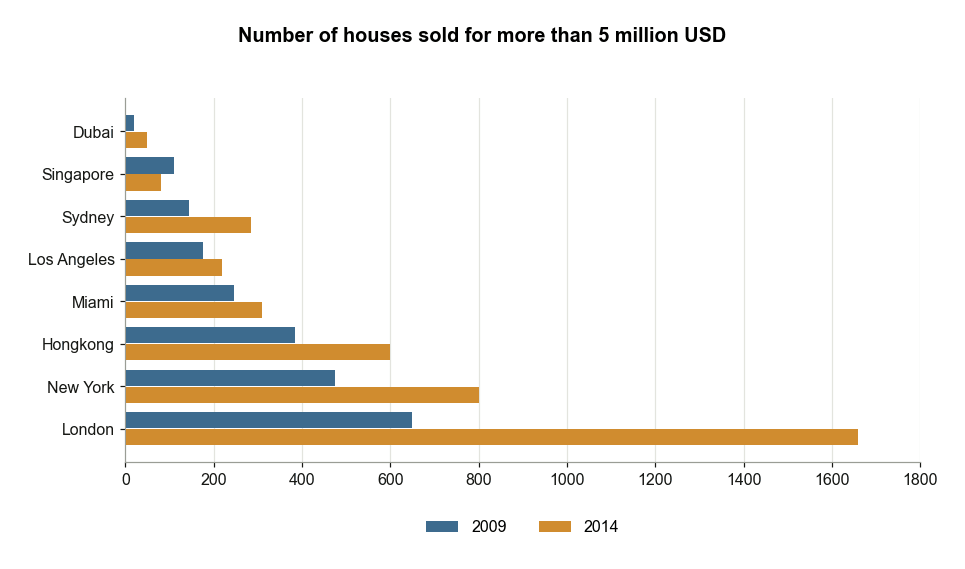
Sales of Homes Worth 5 Million Dollars or More
The bar chart shows the number of homes, each worth 5 million dollars or more, sold in eight cities. Summarise the information by selecting and reporting the main features, and make comparisons where relevant.