
IELTS Academic Writing Task 1Topic
Public transport
Line graph
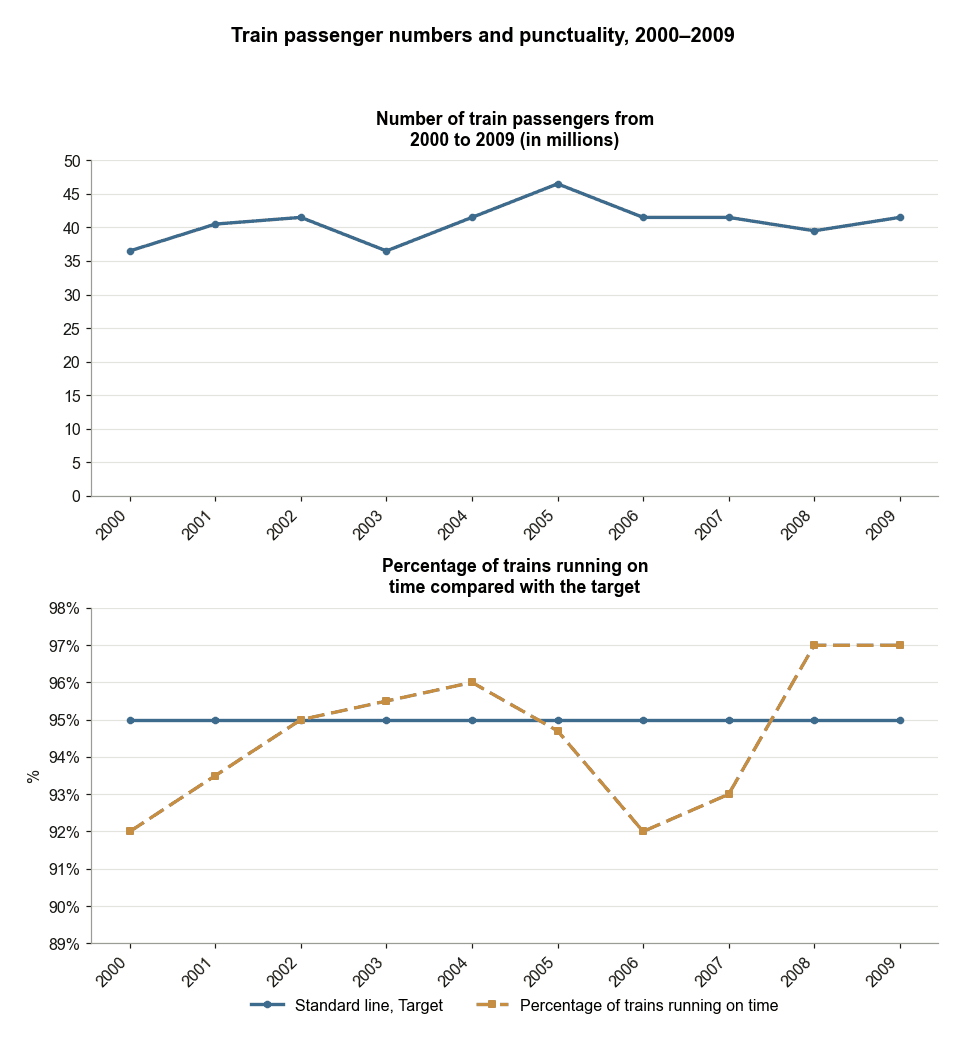
Train Passenger Numbers and Punctuality 2000–2009
The first graph shows the number of train passengers from 2000 to 2009. The second graph shows the percentage of trains running on time. Summarise the information by selecting and reporting the main features, and make comparisons where relevant.
Line graph
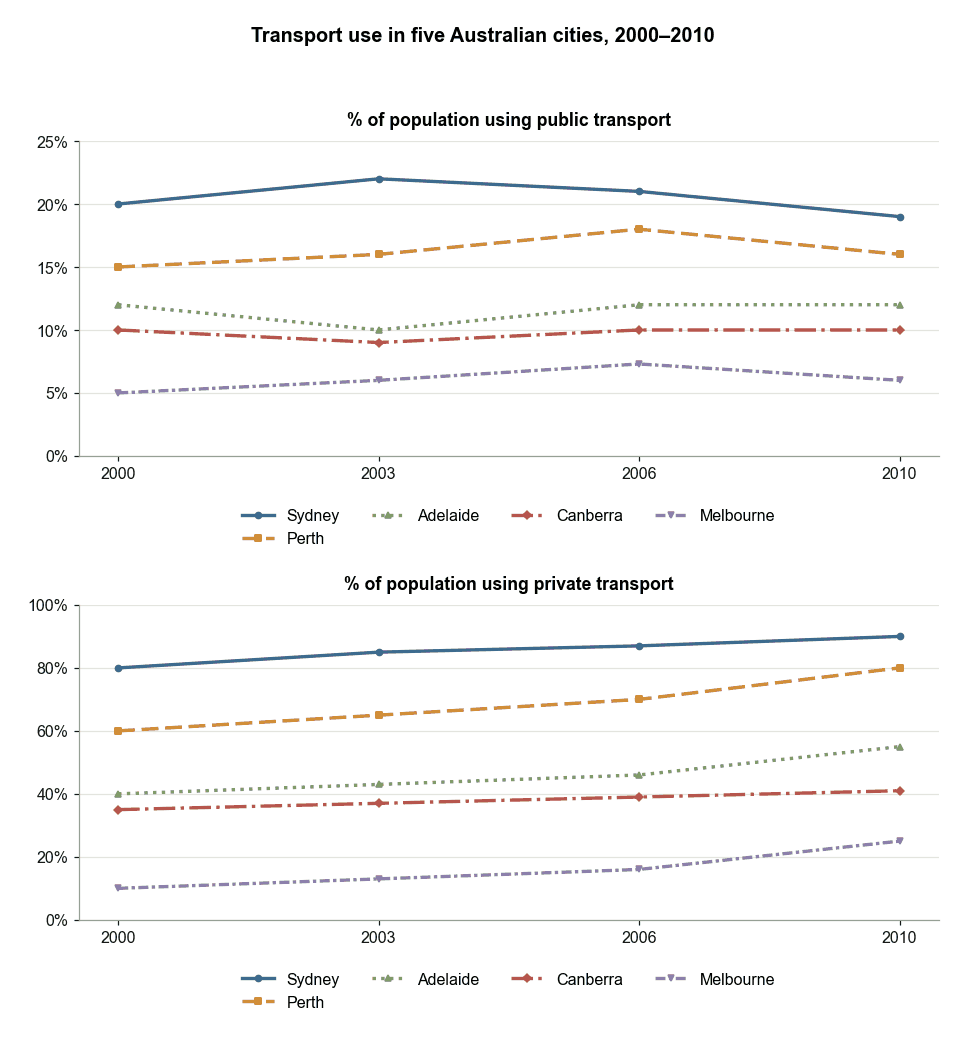
Transport Use in Five Australian Cities
The percentage of people using public transport and only using private cars in five cities in Australia from 2000 to 2010. Summarise the information by selecting and reporting the main features, and make comparisons where relevant.