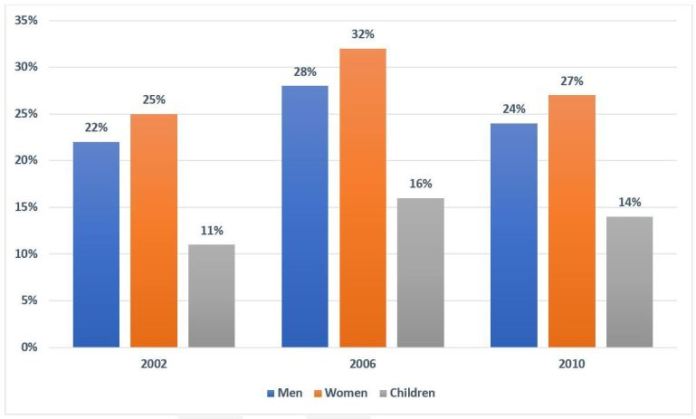
The chart below shows the percentage of the population in the UK who consumed the recommended daily amount of fruits and vegetables in 2002, 2006 and 2010.
The chart illustrates the percentage of men, women and children who consumed the recommended amount of fruit and vegetables on a daily basis in three different years.
Overall, women came out first in term of fruit and vegetable consumption while the opposite was true for children.
In all three years, there was a small difference in the percentage of males and females who consumed enough fruit and vegetables every day. The highest figure for women was 32% in 2006 compared to 28% of men. 2010 witnessed the second highest rank for both women and men’s figures. While 27% of women consumed fruit and vegetables, the percentage of men was 24%. And the smallest figure for both women and men, which was nearly the same as the 2010 figures, was recorded in 2002.
The smallest percentage of people consuming the daily recommended amount of fruit and vegetables was children with only 11% in 2002, half as much as that of men and women in the same year. Following that, the figure for children slightly increased to 16% in 2006 before falling marginally to 14% in the last year.
Estimated band7.0
6.5
7.0
7.0
7.0
Response 02
154 words
The bar chart depicts the percentages of males, females, and children in the United Kingdom who consumed the recommended daily quantity of fruit and vegetables in three different years (2002, 2006 and 2010).
Overall, the proportion of people consuming fruits and vegetables followed an upward trend throughout the time period shown. Furthermore, whereas women consumed the most of these foods, the opposite was true for children.
According to the data, around one-quarter of females in the United Kingdom consumed the recommended quantity of fruits and vegetables in 2002. This was followed by over 22% of males consuming these items on a daily basis, which was twice as high as that of youngsters.
Over the next eight years, the statistics for all categories rose to a peak in 2006, with women accounting for little more than 30% of the total. However, by 2010, the percentage of ladies, males, and children consuming fruit and vegetables had fallen somewhat to 27 percent, 24 percent, and 14 percent, respectively.
Estimated band7.0
7.0
7.0
7.0
7.0
Response 03
159 words
The chart indicates the proportion of the British population who consumed the recommended daily amount of fruit and vegetables in 2002, 2006 and 2010.
As a general trend, the proportion of women is higher compared to the percentages for men and children across the three years, while the percentage for children is usually the lowest across this time period.
Between 2002 and 2006, it can be seen that the percentage of the UK population who consumed the recommended amount of fruit and vegetables increased uniformly across the three different groups before falling across the board between 2006 and 2010. This percentage for women experienced the greatest growth at 7 percent, rising from 25% in 2002 to 32% in 2006.
At the same time, the rate of growth for men and children were comparatively lower, at 6 percent for men and 5 for children between the same four years. Nonetheless, this percentage also dropped the furthest for women between 2006 and 2010, falling by 5 percent, compared to men and children, which fell by 4 and 2 percent respectively.
Estimated band7.0
6.0
7.0
7.0
7.0
Response 04
183 words
The given bar chart illustrates the proportion of British people who consumed the suggested amount of fruit and vegetables on a daily basis in three years: 2002, 2006 and 2010.
Overall, it can be seen that British women’s consumption of fruit and vegetables was far higher than the two remaining groups.
The initial impression from the graph is that the percentage of the recommended amount of fruit and vegetables every day that the British of both genders, namely male and female, consumed was nearly similar. Regarding men, their consumption shared the same pattern in 2002 and 2010 with roughly 23%. In 2010, both figures for men's and women’s consumption of fruit and vegetables reached the highest point at 27% and 32%, respectively. The recommended daily amount of fruit and vegetables consumed by women living in the UK was 25% in 2002 and rose slightly by 2% at the end of the period.
In 2002, children’s daily consumption of fruit and vegetables was much lower than the other groups with approximately one-tenth, which was half of the women’s and men’s consumption in the same year. In the next 4 years, the figure rose to 16% before dropping by 2% in 2010.
Estimated band7.5
7.0
7.5
7.5
7.5
Response 05
151 words
The bar chart illustrates the percentages of males, females and children in the UK consuming the recommended daily amount of fruit and vegetables, in three separate years (2002, 2006 and 2010).
Overall, the proportion of all groups eating fruit and vegetables increased over the period shown. Also, while women had a tendency to consume these foods the most, the group who ate the least amount of fruit and vegetable was children.
As can be seen from the chart, in 2002, approximately a quarter of females in the UK ate fruit and vegetables. This was followed by nearly 22% of males consuming these foods daily, which was double that of children.
Over the following eight years, the figures for all groups increased to reach peaks in 2006 in which the figure for women was highest at just over 30%. By 2010, however, the percentage of females, males and children eating fruit and vegetables had decreased slightly to 27%, 24% and 14% of respectively.
Estimated band7.5
7.0
7.5
7.5
7.5
Response 06
150 words
The bar chart illustrates the percentages of males, females and children in the UK consuming the recommended daily amount of fruit and vegetables, in three separate years (2002, 2006 and 2010).
Overall, the proportion of all groups eating fruit and vegetables increased over the period shown. Also, while women had a tendency to consume these foods the most, the opposite was true for children.
As can be seen from the chart, in 2002, approximately a quarter of females in the UK ate the recommended amount of fruit and vegetables. This was followed by nearly 22% of males consuming these foods daily, which was two times higher than that of children.
Over the following eight years, the figures for all groups increased to reach peaks in 2006 in which the figure for women was highest at just over 30%. By 2010, however, the percentage of females, males and children eating fruit and vegetables had decreased slightly to 27%, 24% and 14% respectively.
TA Task AchievementCC Coherence & CohesionLR Lexical ResourceGRA Grammatical Range & Accuracy
From essays on this question
Useful vocabulary
recommended daily amount
Meaning
The quantity of a food that people are advised to eat each day.
From the essay
The chart indicates the proportion of the British population who consumed the recommended daily amount of fruit and vegetables in 2002, 2006 and 2010.