
IELTS Academic Writing Task 1Topic
Diet and nutrition
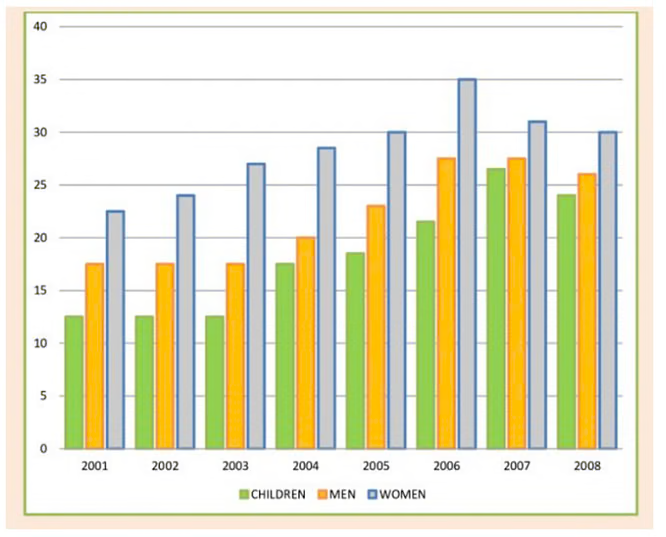
UK Daily Fruit and Vegetable Consumption 2001-2008
The chart below shows the percentage of people who ate five portions of fruits and vegetables per day in the UK from 2001 to 2008.
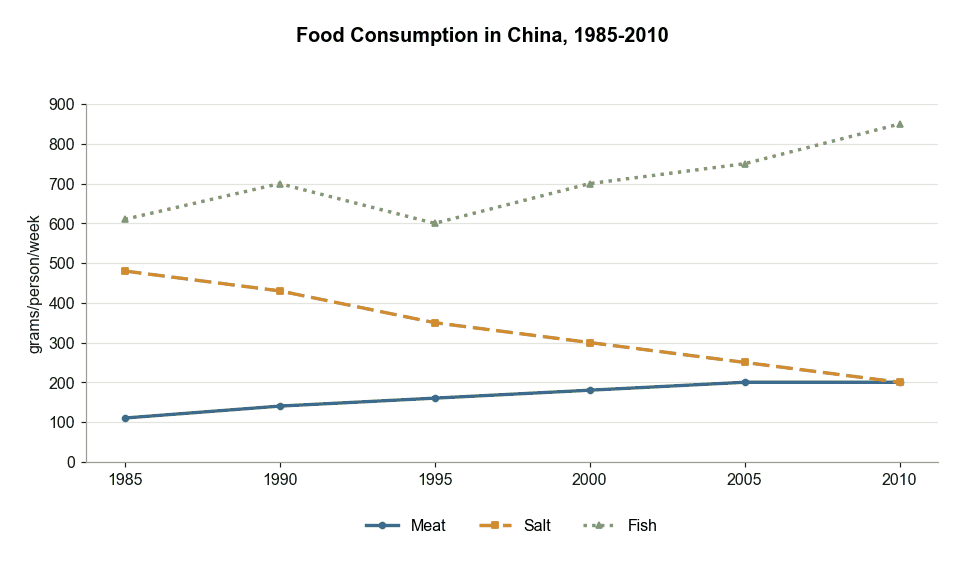
Food Consumption in China Between 1985 and 2010
The graph below shows the changes in food consumption by Chinese people between 1985 and 2010. Summarise the information by selecting and reporting the main features, and make comparisons where relevant.
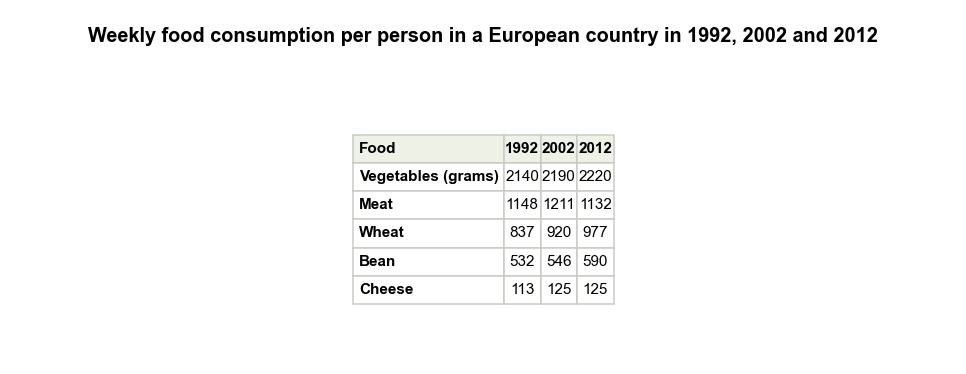
Weekly European Food Consumption
The table below presents the food consumption per person weekly in a European country in 1992,2002, and 2012. Summarise the information by selecting and reporting the main features, and make comparisons where relevant.
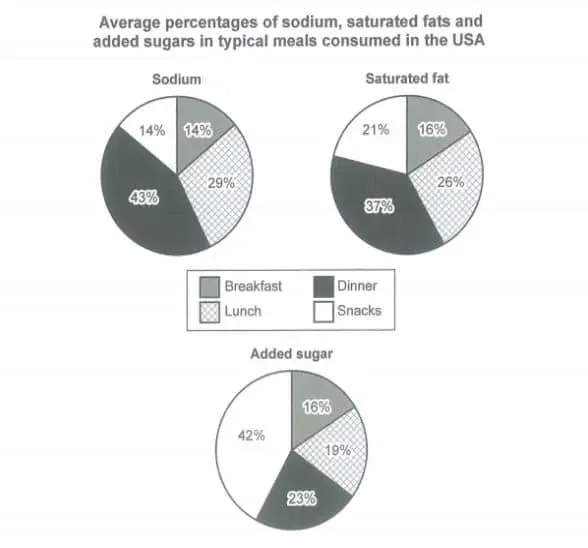
Nutrients in Typical US Meals Pie Charts
The charts below show the average percentages in typical meals of three types of nutrients, all of which may be unhealthy if eaten too much. Summarise the information by selecting and reporting the main features, and make comparisons where relevant.
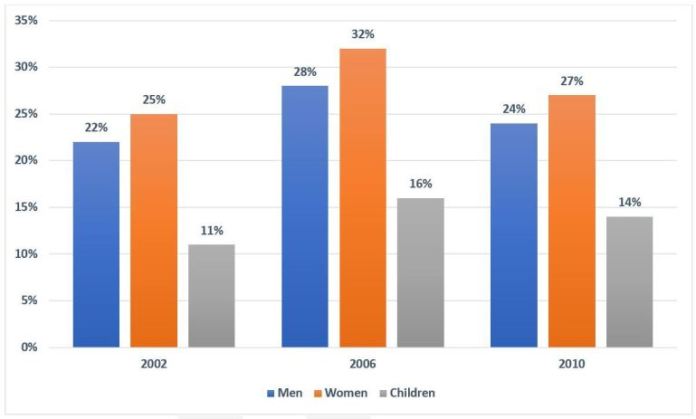
UK Fruit and Vegetable Consumption Rates
The chart below shows the percentage of the population in the UK who consumed the recommended daily amount of fruits and vegetables in 2002, 2006 and 2010.