
IELTS Academic Writing Task 1Topic
Films
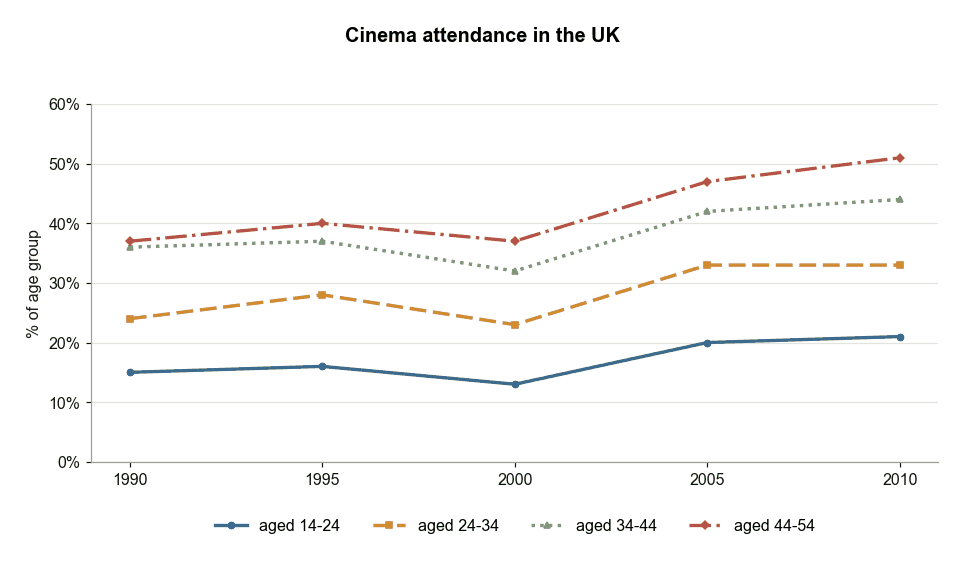
Cinema Attendance by Age Group in the UK
The line graph below gives information on cinema attendance in the UK. Summarise the information by selecting and reporting the main features, and make comparisons where relevant.
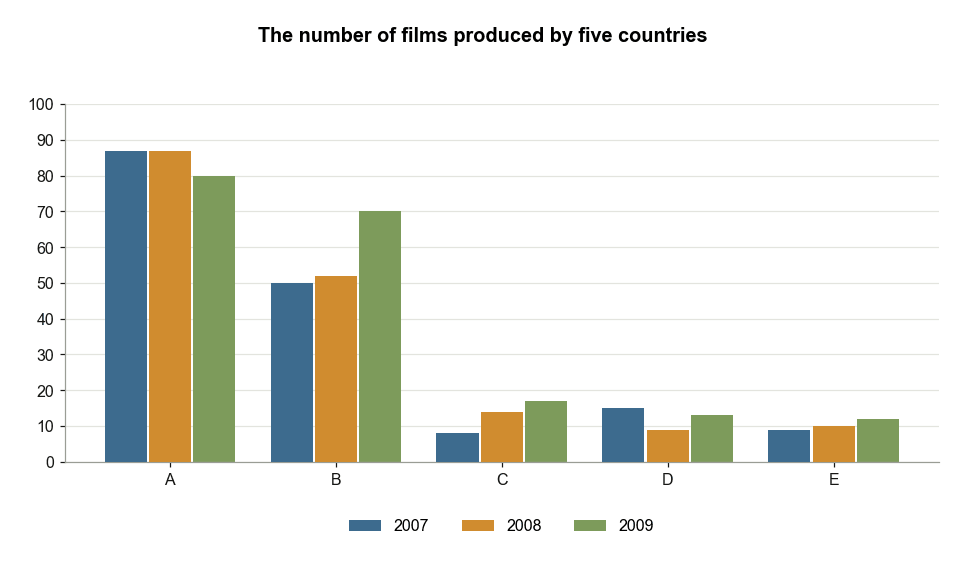
Films Produced by Five Countries in Three Years
The chart below shows the number of films produced by five countries in three years. Summarise the information by selecting and reporting the main features, and make comparisons where relevant.
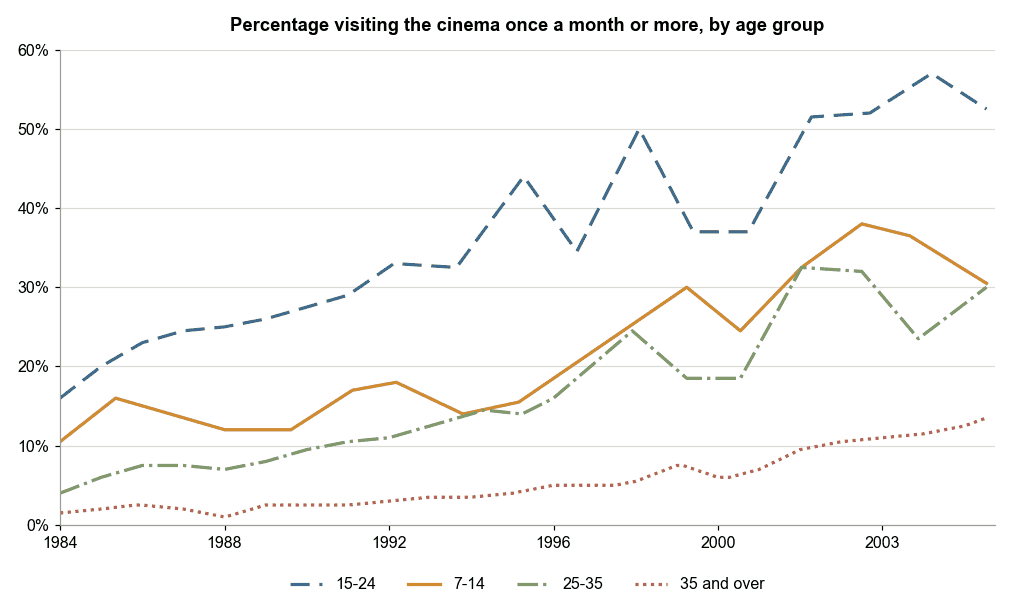
Monthly Cinema Attendance by Age Group (1984–2003)
The graph shows the percentage of visiting the cinema once a month or more between 1984 to 2003 (4 age groups). Summarise the information by selecting and reporting the main features, and make comparisons where relevant.
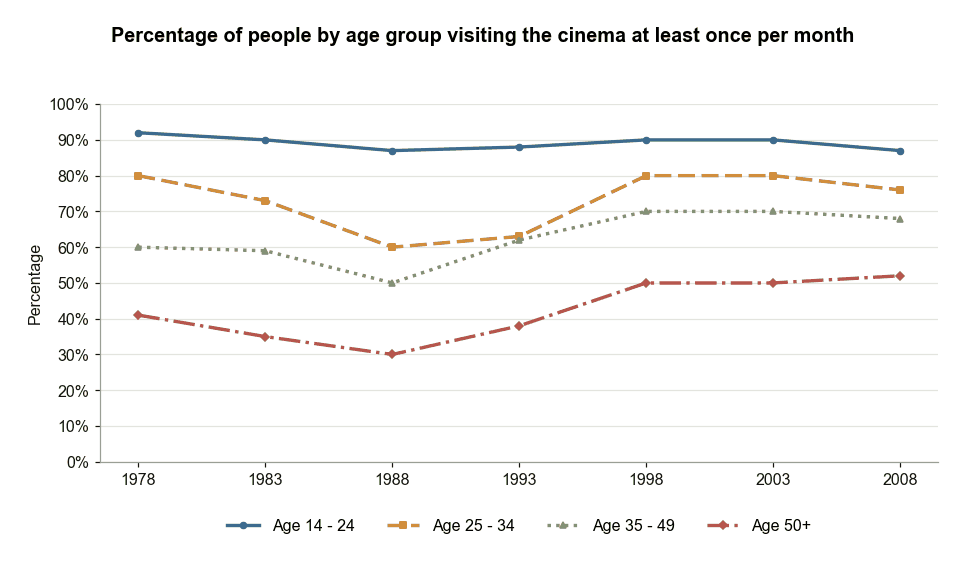
Monthly Cinema Attendance by Age Group (1978–2008)
The graph below shows the percentage of people by age group visiting the cinema at least once per month in one particular country between 1978 and 2008. Summarise the information by selecting and reporting the main features, and make comparisons where relevant.