
雅思A类小作文话题
公共交通
Public transport
折线图
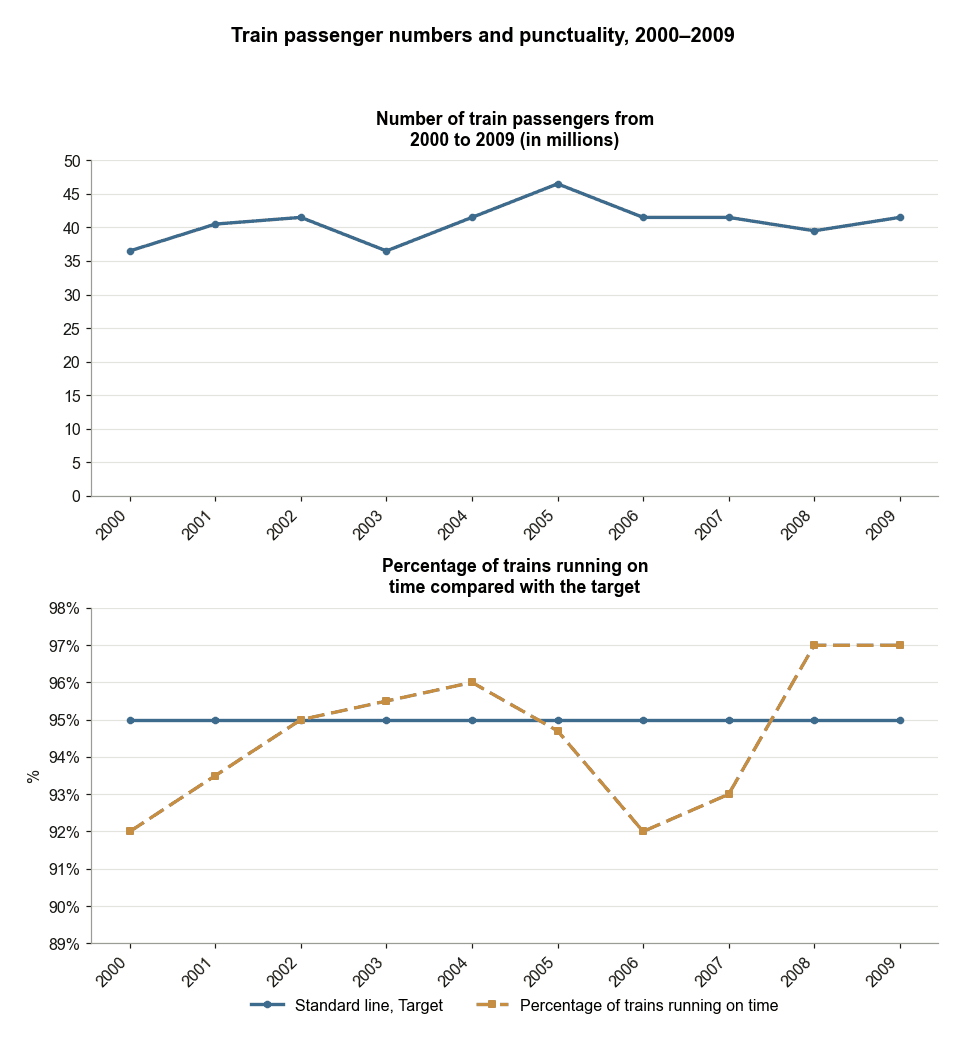
2000至2009年火车乘客量与准点率
Train Passenger Numbers and Punctuality 2000–2009The first graph shows the number of train passengers from 2000 to 2009. The second graph shows the percentage of trains running on time. Summarise the information by selecting and reporting the main features, and make comparisons where relevant.
折线图
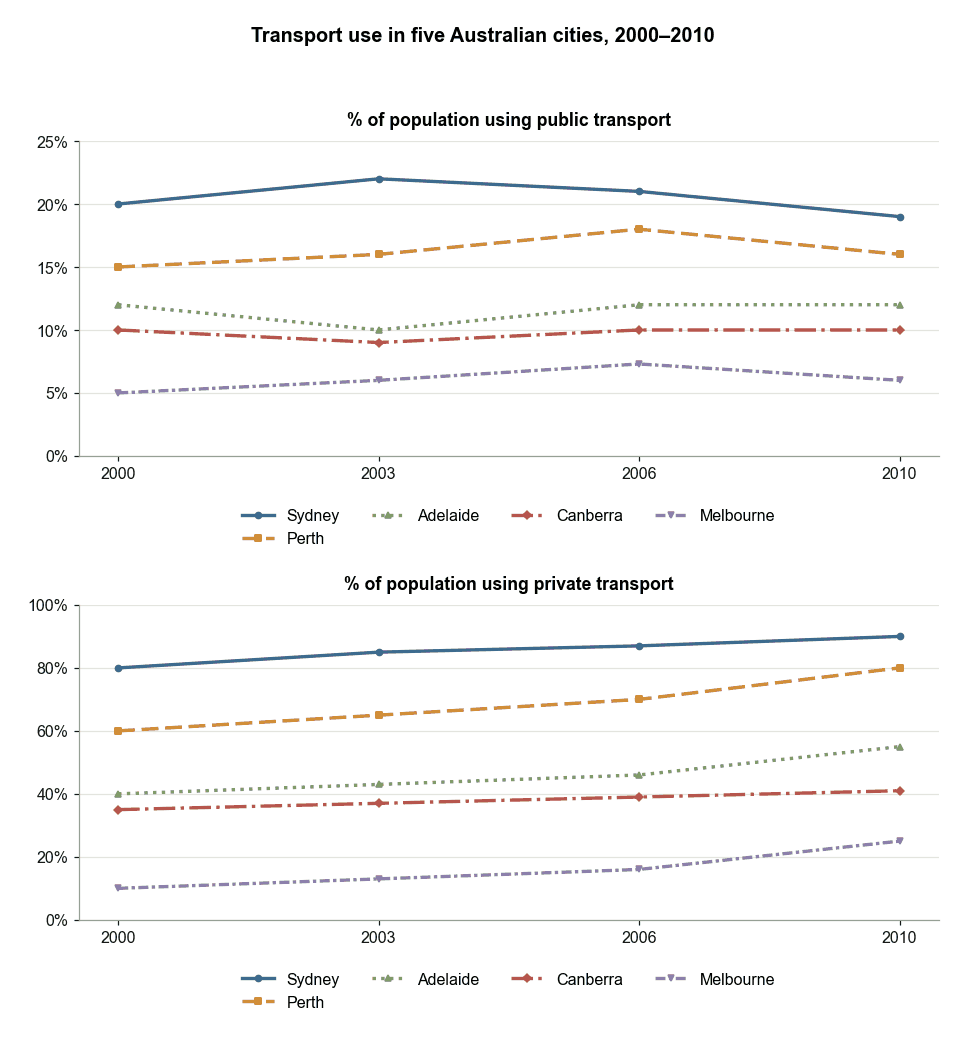
澳大利亚五个城市的交通方式使用情况
Transport Use in Five Australian CitiesThe percentage of people using public transport and only using private cars in five cities in Australia from 2000 to 2010. Summarise the information by selecting and reporting the main features, and make comparisons where relevant.