
Overview
1 pointOverall, all population categories are expected to increase over the period.
Find in essay
Recycled · 2026More recent exam questions
The graphs below illustrate trends in population in Southern Pacific Ocean countries from 1950, with projections up to 2040.
Summarise the information by selecting and reporting the main features, and make comparisons where relevant.
1 sample answer, estimated Band 7.5. Your turn?
Write it first, then read the sample answers and reviews below. You'll see the gap at once.
From essays on this question
WhyThis is aLine graph — it asks you to report the main trends and changes over time.
SoWe split the points intoOverview(the main trends over the period)andKey features(figures and comparisons worth reporting).
Overall, all population categories are expected to increase over the period.
In 1950, the total population stood at approximately 12 million, comprising around 8 million urban residents and 4 million living in rural areas.
Between 1950 and 2040, both the total and urban populations are projected to rise markedly, with the urban figure reaching approximately 33 million by the end of the period.
By contrast, the rural population is expected to increase only gradually to around 11 million.
Same question · Different responses
Answer · 208 words · 4 paragraphs · 9 comments
From essays on this question
In 1950, the total population stood at approximately 12 million, comprising around 8 million urban residents and 4 million living in rural areas.
By contrast, the rural population is expected to increase only gradually to around 11 million.
In 1950, the total population stood at approximately 12 million, comprising around 8 million urban residents and 4 million living in rural areas.
Practise this question
You should spend about 20 minutes on this task. Write at least 150 words.
Related questions
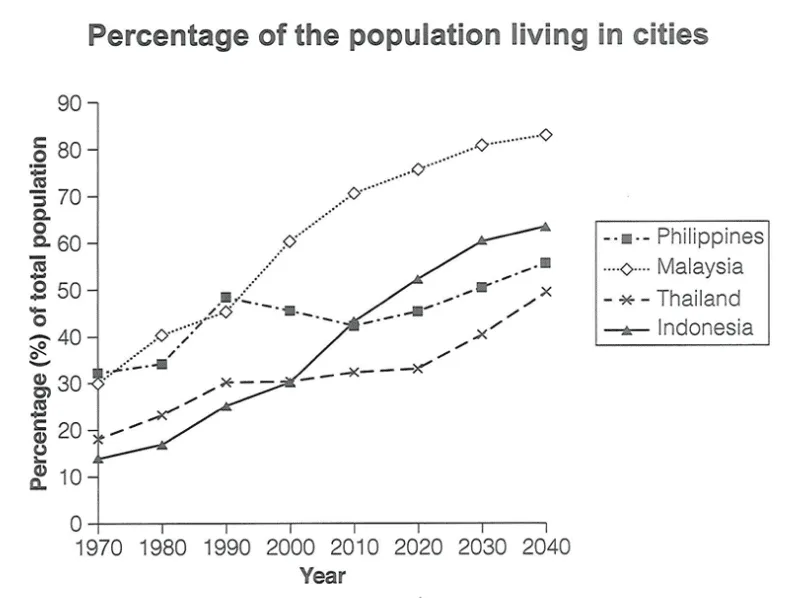
The graph below gives information about the percentage of the population in four Asian countries living in cities from 1970 to 2020, with predictions for 2030 and 2040. Summarise the information by selecting and reporting the main features, and make comparisons where relevant.
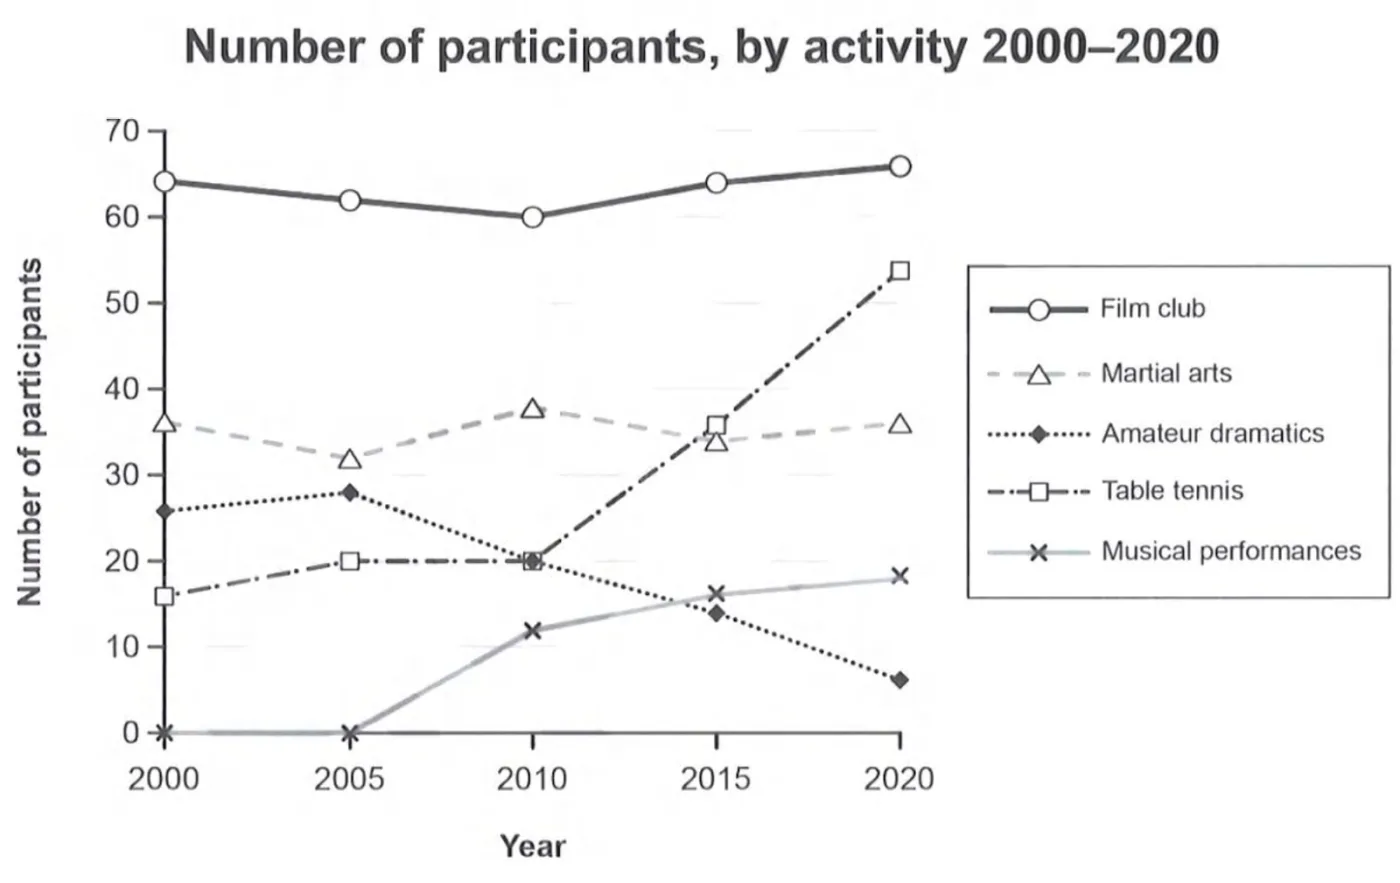
The graph below gives information on the numbers of participants for different activities at one social centre in Melbourne, Australia for the period 2000 to 2020. Summarise the information by selecting and reporting the main features, and make comparisons where relevant.
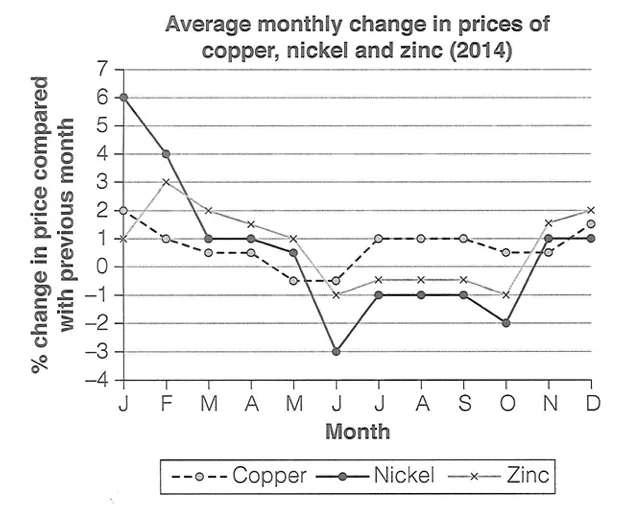
The graph below shows the average monthly change in the prices of three metals during 2014. Summarise the information by selecting and reporting the main features, and make comparisons where relevant.