UK Fruit and Vegetable Consumption Rates

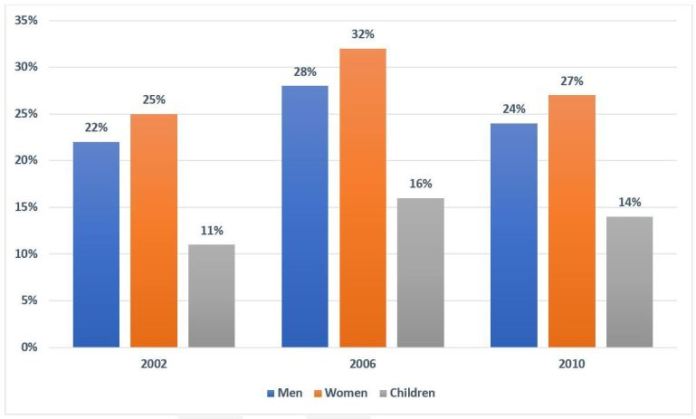
The chart below shows the percentage of the population in the UK who consumed the recommended daily amount of fruits and vegetables in 2002, 2006 and 2010.

IELTS Academic Writing Task 1 question image

Annotated response

6 correction notes

Showing 6 correction notes.

The given bar chart illustrates the proportion of British people who consumed the suggested amount of fruit and vegetables on a daily basis in three years: 2002, 2006 and 2010.

Overall, it can be seen that British women’s consumption of fruit and vegetables was far higher than the two remaining groups.

The initial impression from the graph is that the percentage of the recommended amount of fruit and vegetables every day that the British of both genders, namely male and female, consumed was nearly similar. Regarding men, their consumption shared the same pattern in 2002 and 2010 with roughly 23%. In 2010, both figures for men's and women’s consumption of fruit and vegetables reached the highest point at 27% and 32%, respectively. The recommended daily amount of fruit and vegetables consumed by women living in the UK was 25% in 2002 and rose slightly by 2% at the end of the period.

In 2002, children’s daily consumption of fruit and vegetables was much lower than the other groups with approximately one-tenth, which was half of the women’s and men’s consumption in the same year. In the next 4 years, the figure rose to 16% before in 2010.

Overall assessment

Why this response received Band 7.0

The response is well organised with a clear overview and mostly fluent, flexible language. Its main limitation is a series of data inaccuracies, as several figures are attributed to the wrong years or values compared with the chart, weakening the reliability of the description.

IELTS criteria

How each score was decided

Task Achievement

6.0

All groups and years are covered, and the overview identifies women as the largest group. However, every group peaks in 2006, not 2010. The figures measure percentages of people meeting the recommended daily intake, not quantities of food consumed; repeated confusion about this metric and inaccurate adult figures weaken the report.

Coherence and Cohesion

7.0

Ideas are arranged logically with clear paragraphing, a positioning statement, and effective use of cohesive devices such as 'Regarding' and 'In the next 4 years', giving a generally smooth progression.

Lexical Resource

7.0

There is a useful range of trend language, including 'reached the highest point' and 'rose slightly'. However, repeated references to consumption blur the distinction between amounts of food and percentages of people meeting a recommendation, and several descriptions are unnecessarily wordy.

Grammatical Range and Accuracy

7.0

Relative clauses and other complex structures are generally controlled, and most sentences remain intelligible. The long adult-comparison sentence is cumbersome, but 'shared the same pattern' is grammatically possible; its weakness here concerns the accuracy and precision of the comparison.