
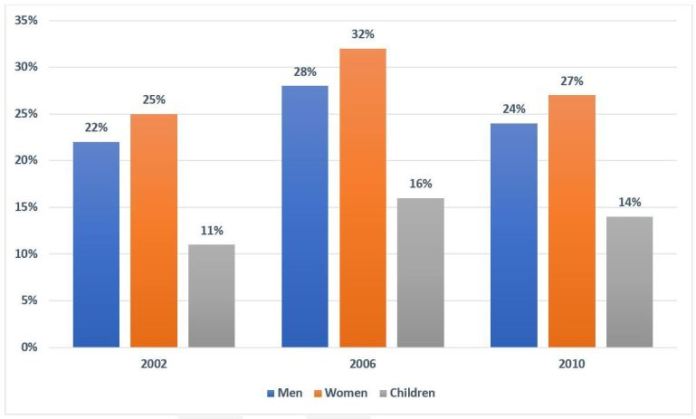
The bar chart illustrates the percentages of males, females and children in the UK consuming the recommended daily amount of fruit and vegetables, in three separate years (2002, 2006 and 2010).
Overall, the proportion of all groups eating fruit and vegetables increased over the period shown. Also, while women had a tendency to consume these foods the most, the opposite was true for children.
As can be seen from the chart, in 2002, approximately a quarter of females in the UK ate the recommended amount of fruit and vegetables. This was followed by of males consuming these foods daily, which was that of children.
Over the following eight years, the figures for all groups increased to reach peaks in 2006 in which the figure for women was highest at just over 30%. By 2010, however, the percentage of females, males and children eating fruit and vegetables had decreased slightly to 27%, 24% and 14% respectively.