
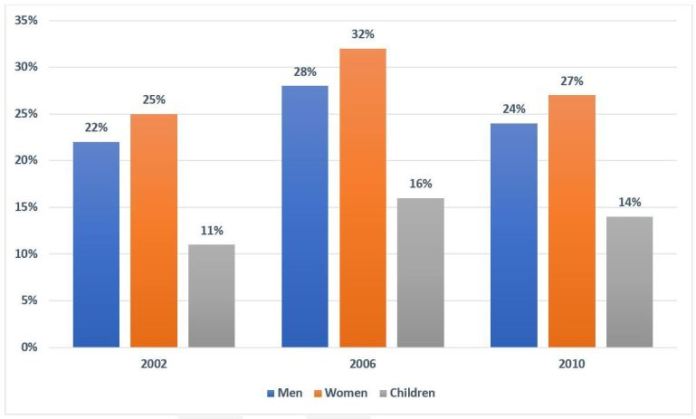
The chart indicates the proportion of the British population who consumed the recommended daily amount of fruit and vegetables in 2002, 2006 and 2010.
As a general trend, the proportion of women is higher compared to the percentages for men and children across the three years, while the percentage for children is usually the lowest across this time period.
Between 2002 and 2006, it can be seen that the percentage of the UK population who consumed the recommended amount of fruit and vegetables increased uniformly across the three different groups before falling across the board between 2006 and 2010. This percentage for women experienced the greatest growth , rising from 25% in 2002 to 32% in 2006.
At the same time, the comparatively lower, at 6 percent for men and 5 for children between the same four years. Nonetheless, this percentage also dropped the furthest for women between 2006 and 2010, falling by 5 percent, compared to men and children, which fell by 4 and 2 percent respectively.