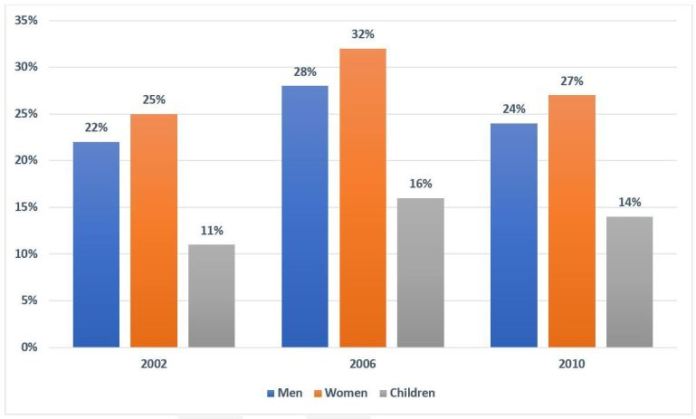
UK Fruit and Vegetable Consumption Rates

The chart below shows the percentage of the population in the UK who consumed the recommended daily amount of fruits and vegetables in 2002, 2006 and 2010.

IELTS Academic Writing Task 1 question image

Annotated response

4 correction notes

Showing 4 correction notes.

The chart indicates the proportion of the British population who consumed the recommended daily amount of fruit and vegetables in 2002, 2006 and 2010.

As a general trend, the proportion of women is higher compared to the percentages for men and children across the three years, while the percentage for children is usually the lowest across this time period.

Between 2002 and 2006, it can be seen that the percentage of the UK population who consumed the recommended amount of fruit and vegetables increased uniformly across the three different groups before falling across the board between 2006 and 2010. This percentage for women experienced the greatest growth , rising from 25% in 2002 to 32% in 2006.

At the same time, the comparatively lower, at 6 percent for men and 5 for children between the same four years. Nonetheless, this percentage also dropped the furthest for women between 2006 and 2010, falling by 5 percent, compared to men and children, which fell by 4 and 2 percent respectively.

Overall assessment

Why this response received Band 7.0

The response's strongest aspect is its accurate and complete coverage of the data, with a clear overview of group rankings and a well-organized account of the rise and fall across the three years. The main limitation is repetitive word choice and a few grammatical slips that slightly reduce the polish of otherwise controlled language.

IELTS criteria

How each score was decided

Task Achievement

7.0

The response covers all three groups and years with accurate figures matching the chart, presents a clear overview of women being highest and children lowest, and correctly describes the rise to 2006 and fall to 2010, though comparisons could be extended slightly further.

Coherence and Cohesion

7.0

Ideas progress logically from overview to detailed trend descriptions, with effective use of cohesive devices such as 'as a general trend', 'nonetheless', and 'respectively', although some referencing of 'this percentage' is slightly loose.

Lexical Resource

7.0

The response uses a sufficient range of trend vocabulary including 'increased uniformly', 'falling across the board', and 'comparatively lower', but repetition of 'percentage' and 'proportion' shows room for greater flexibility.

Grammatical Range and Accuracy

7.0

A good variety of complex structures is used accurately, including relative and comparative clauses, with only occasional slips such as 'the rate of growth for men and children were' that do not impede meaning.