Family Weekly Spending in 1968 and 2018

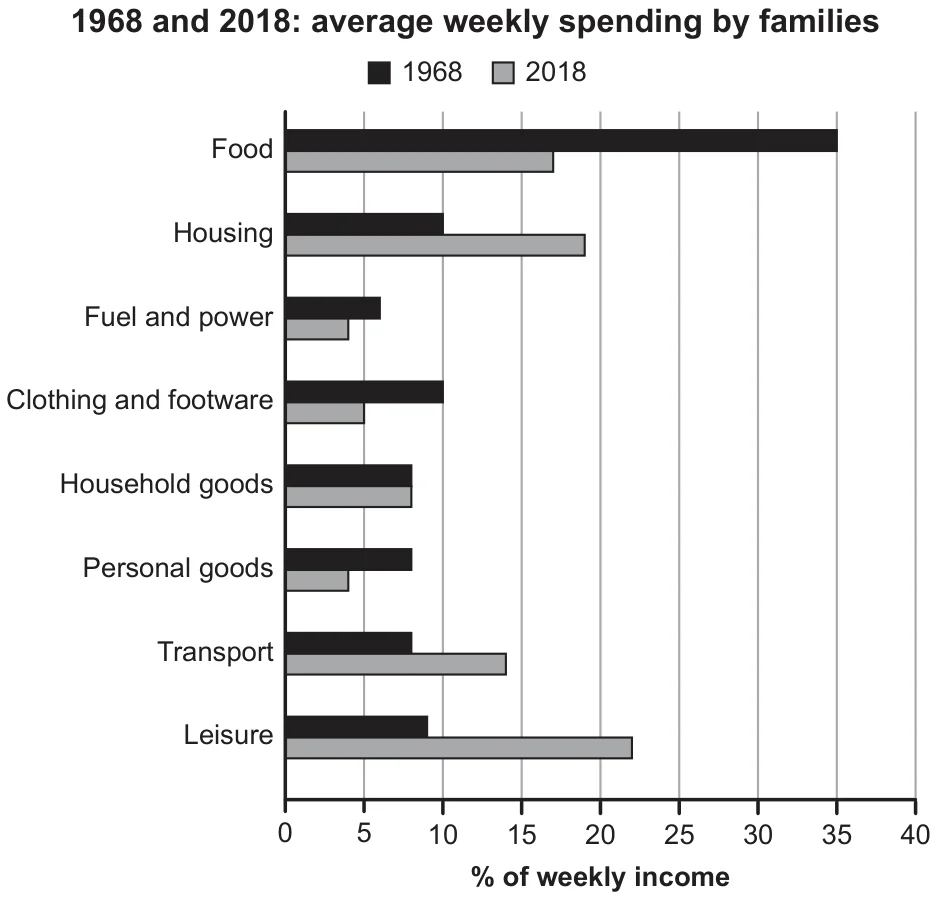
The chart below gives information about how families in one country spent their weekly income in 1968 and in 2018. Summarise the information by selecting and reporting the main features, and make comparisons where relevant.

Cambridge IELTS 17 Academic Test 3 Writing Task 1 visual

Annotated response

7 correction notes

Showing 7 correction notes.

The provided bar graph illustrates the spending patterns of the average family in a particular country in the years 1968 and 2018. Notably, there have been substantial shifts in expenditure over the decades, with leisure and housing surpassing food as the primary areas of financial allocation.

Overall, the way families spent their income significantly by compared with the past. leisure and housing had overtaken food as the largest areas of expenditure.

In 1968, the , at 35%, was spent on . However, by 2018, this proportion had nearly halved, dropping to approximately 17%. During the earlier period, no other spending category exceeded 10% of the weekly income. In contrast, in 2018, both leisure and housing experienced a noteworthy surge, emerging as the predominant expenditures, constituting around 22% and 19% of family income, respectively.

The allocation for transport also saw an increase, reaching almost 15% of the weekly income. Expenditure on household goods remained relatively constant at around 7%. Conversely, spending on clothing and footwear, fuel and power, as well as personal goods, all witnessed a decline, each representing no more than 5% of the weekly income.

Overall assessment

Why this response received Band 8.0

The response demonstrates strong data selection and accurate reporting of the chart, with a clear overview and well-chosen comparisons across all categories. Its main limitation is some redundancy between the introduction and overview, together with occasional awkwardly phrased connective language, though grammar and vocabulary remain impressively controlled throughout.

IELTS criteria

How each score was decided

Task Achievement

8.0

The response covers all key features with accurate figures (food 35% to about 17%, leisure around 22%, housing around 19%) and a clear overview of the reversal from food to leisure and housing, with no invented data and only a small loss from duplicated overview content.

Coherence and Cohesion

7.0

Progression is logical across paragraphs with effective use of contrast markers such as however, in contrast and conversely, though the overview partly repeats the introduction and the phrase 'To mention' disrupts cohesion.

Lexical Resource

8.0

Vocabulary is flexible and precise for describing change, including 'substantial shifts', 'noteworthy surge', 'predominant expenditures' and 'nearly halved', with only the informal 'To mention' standing out.

Grammatical Range and Accuracy

8.0

A wide range of structures is handled flexibly, including accurate past perfect forms ('had nearly halved') and complex noun phrases, with only rare, non-impeding errors.