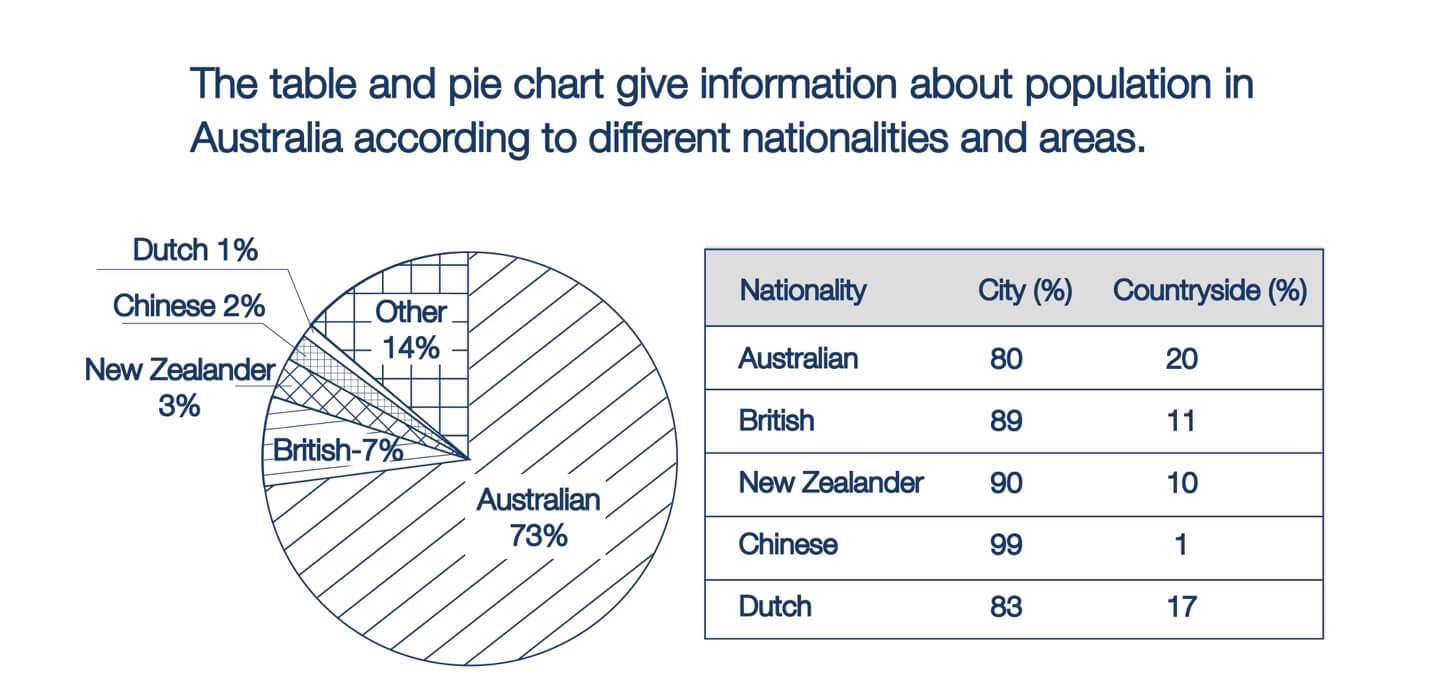
Australia Population by Nationality and Area

The table and pie chart give information about the population in Australia according to different nationalities and areas.

IELTS Academic Writing Task 1 question image

Annotated response

3 correction notes

Showing 3 correction notes.

The pie chart and table compare various demographics in Australia by nationality and location of residence. Overall, native Australians are the most populous segment, and Dutch people account for the least. In addition, the Chinese population is most likely to inhabit cities, whereas the proportion of Australians living in rural areas is highest among all nationalities.

From the pie chart, it could be seen that for the vast majority of the population in Australia, with 73%. Of the remaining origins , British people make up 7% of residents, which is more than twice the proportion of New Zealanders, with 3%. The percentages of Chinese and Dutch populations stand at the bottom with 2% and 1%, respectively, whereas other unspecified ethnicities altogether account for 14% of Australia’s population.

Regarding the table for demographic breakdown by location, virtually all Chinese people are urban inhabitants, with 99%. This is followed by New Zealanders, 90% of whom reside in cities, and British people, who report a level of 89%. Dutch and tend to be urbanites as well, though to a lesser degree. Whereas 83% of Dutch people are city-dwellers, the percentage of Australians is marginally less at 80%. One-fifth of in the countryside, which corresponds to a quarter of their urban residents.

Overall assessment

Why this response received Band 8.0

The response accurately covers both visuals, identifies the main patterns and makes useful comparisons with varied language and clear organisation. The final quarter comparison is correct because 20 is one quarter of 80. The main refinement is to retain the visual’s nationality labels consistently rather than imply a different classification through "native Australians" or "ethnicities".

IELTS criteria

How each score was decided

Task Achievement

8.0

The response covers both visuals with accurate figures, a clear overview and relevant comparisons. The final rural-to-urban comparison is mathematically correct: the Australian countryside share of 20% is one quarter of the city share of 80%.

Coherence and Cohesion

8.0

Ideas progress logically across a clear overview and two well-organized body paragraphs, with a wide range of cohesive devices used naturally.

Lexical Resource

8.0

Vocabulary is flexible and varied, with accurate expressions such as account for and marginally less. However, "native Australians" and "ethnicities" are less precise than the chart’s nationality categories and could imply birthplace, Indigenous identity or ethnicity that the visual does not establish.

Grammatical Range and Accuracy

8.0

A wide range of structures, including relative clauses and contrastive constructions, is used with flexibility and consistent accuracy.