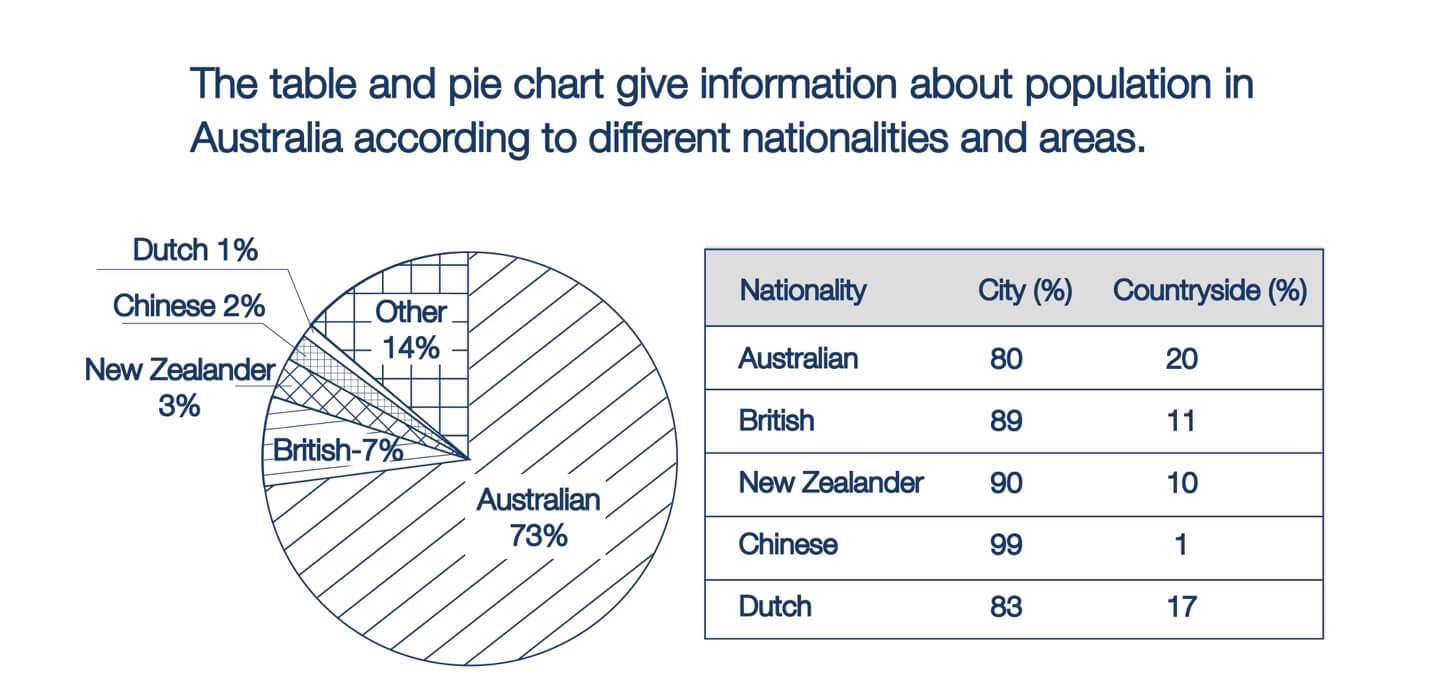
Australia Population by Nationality and Area

The table and pie chart give information about the population in Australia according to different nationalities and areas.

IELTS Academic Writing Task 1 question image

Annotated response

3 correction notes

Showing 3 correction notes.

The pie chart depicts the constitution of those residing in Australia with respect to their nationalities, whereas the table details where these people live in an unspecified year.

Overall, what stands out from the graph is that Australian demographics hold the lion’s share in the population of this nation. Another interesting point is that most residents opt for the city regardless of ethnicity.

With regards to the pie chart, local Australian people represent nearly three fourths (73%) of the total population. other countries with 14%, whilst 7% come from the UK. Those whose home countries are in Dutch, China and New Zealand hold a negligible 1-3% of total people residing in Australia.

In terms of the table, the vast majority of surveyed Australian demographics favour living in the city with 8 out of 10. A similar pattern can be seen in the figures for Dutch, British and New Zealander residents, amounting to 83%, 89% and 90% respectively. This trend is particularly evident in Chinese people with 99% choosing to live in the city.

Overall assessment

Why this response received Band 7.0

The response covers both visuals accurately, with a clear overview and well-chosen key figures, which is its strongest aspect. The main limitation is occasional imprecise or awkward word choice, such as 'constitution' and 'home countries are in Dutch', alongside some tense inconsistency.

IELTS criteria

How each score was decided

Task Achievement

7.0

The response covers all nationalities and their city/countryside figures accurately, with a clear overview highlighting the dominant Australian share and the urban trend, though the countryside side of the table receives lighter treatment.

Coherence and Cohesion

7.0

Ideas are logically organised into an overview followed by chart and table paragraphs, with cohesive devices used naturally, though referencing such as 'these people' and 'Australian demographics' is occasionally loose.

Lexical Resource

7.0

There is a good range of vocabulary for describing proportions and trends, but some imprecise expressions ('constitution', 'home countries are in Dutch', 'Australian demographics favour') reduce precision.

Grammatical Range and Accuracy

7.0

A variety of complex structures, including relative clauses and participial phrases, is used flexibly, with only occasional slips in tense consistency and number agreement that do not impede meaning.