
Overview
2 pointsIn general, most immigrants planned to reside in the UK for a maximum of two years.
Find in essay In addition, work was the primary reason for migration to the UK in 2008.
Find in essay
Recycled · 2026More recent exam questions
The graph and chart below give information about migration to the UK. The graph below shows how long immigrants in the year 2000-2008 intended to stay in the UK. And the pie-chart shows reasons for migration in 2008.
Summarise the information by selecting and reporting the main features, and make comparisons where relevant.
1 sample answer, estimated Band 7.5. Your turn?
Write it first, then read the sample answers and reviews below. You'll see the gap at once.
From essays on this question
WhyThis is aMixed charts task — it asks you to connect the main patterns across two visuals.
SoWe split the points intoOverview(the main point of each chart)andKey features(figures and comparisons worth reporting).
In general, most immigrants planned to reside in the UK for a maximum of two years.
In addition, work was the primary reason for migration to the UK in 2008.
In 2000, most immigrants aimed to reside in the UK for "up to 2 years" and "4 or more years" (both categories were around 150,000).
The following years saw a substantial increase in the former category, peaking in 2004 (at roughly 250,000).
In contrast, those intending to reside for four or more years had a stable figure throughout the period, fluctuating around 150,000.
Lastly, in the same time frame, the number of immigrants planning to stay for 2 to 4 years ranged between 50,000 to 60,000, with a significant jump to 100,000 in 2008.
In 2008, the pie chart delineates that work and study were the most prominent reasons for migration, accounting for 38% and 32% of all immigrants, respectively, while accompanying or joining the family constituted only 16%.
Finally, unlisted reasons and non-respondents both comprised 7% each.
Same question · Different responses
Answer · 175 words · 4 paragraphs · 9 comments
From essays on this question
The line graph represents immigrants' intended duration of stay in the UK from 2000 to 2008.
In addition, work was the primary reason for migration to the UK in 2008.
Practise this question
You should spend about 20 minutes on this task. Write at least 150 words.
Related questions
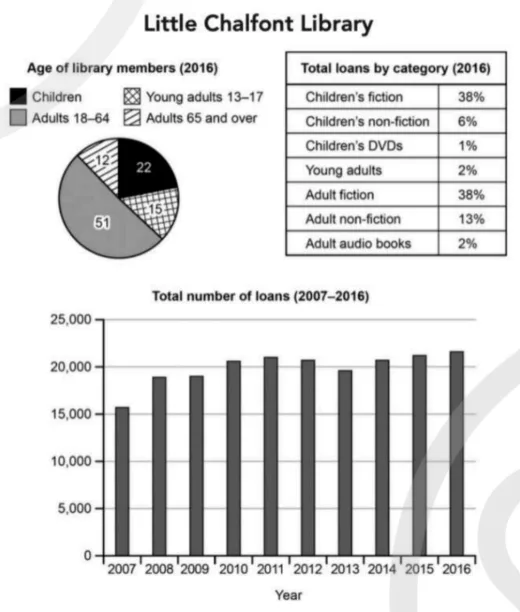
The charts below give information about a public library in a town called Little Chalfont. Summarise the information by selecting and reporting the main features, and make comparisons where relevant.
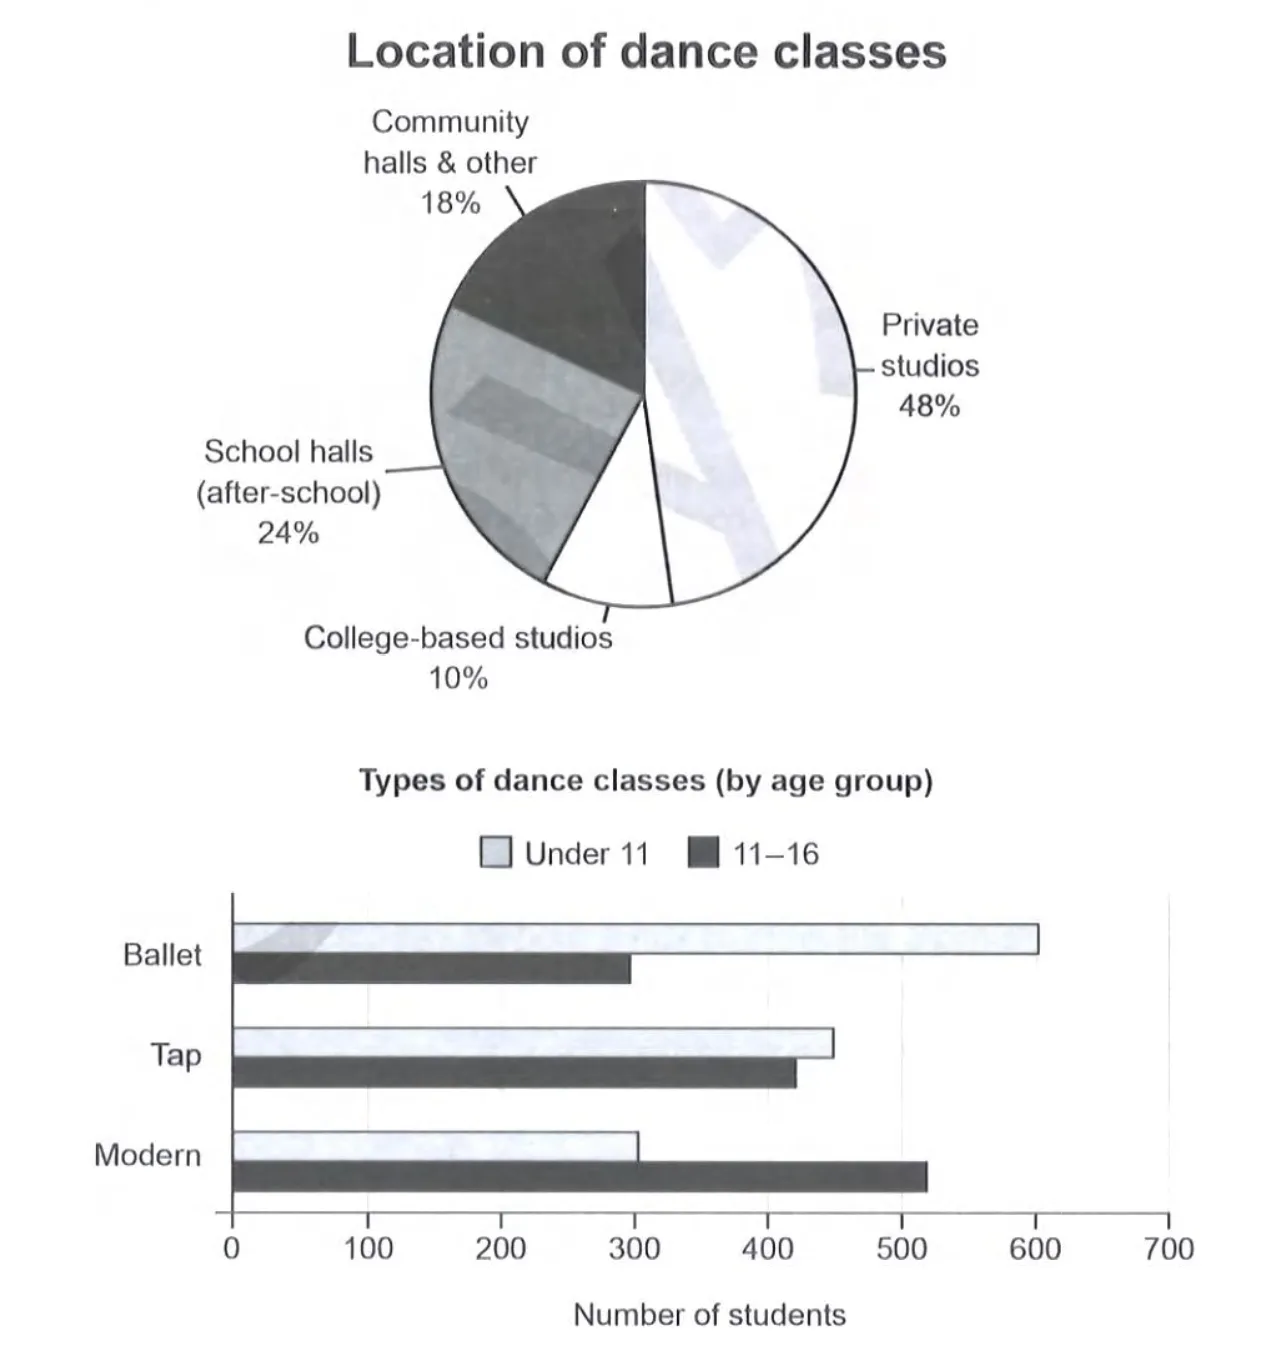
The charts below give information on the location and types of dance classes young people in a town in Australia are currently attending. Summarise the information by selecting and reporting the main features, and make comparisons where relevant.
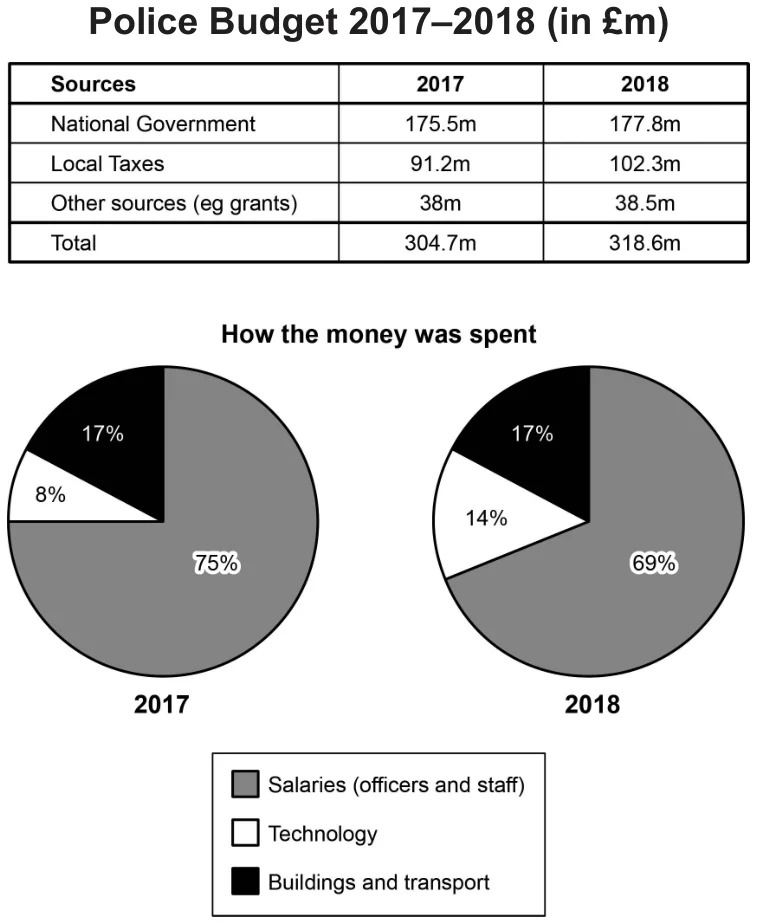
The table and charts below give information on the police budget for 2017 and 2018 in one area of Britain. The table shows where the money came from and the charts show how it was distributed. Summarise the information by selecting and reporting the main features, and make comparisons where relevant.