
Estimated band8.0
- 8.0
- 8.0
- 8.0
- 8.0
Response 01
192 wordsThe tables illustrate how the total population of New York City and its five districts (Manhattan, Brooklyn, Bronx, Queens, and Staten Island) changed from 1800 to 2000.
The first table below shows changes in the total population of New York City from 1800 to 2000. The second and third tables show changes in the population of the five districts of the city (Manhattan, Brooklyn, Bronx, Queens, Staten Island) over the same period. Summarise the information by selecting and reporting the main features, and make comparisons where relevant.
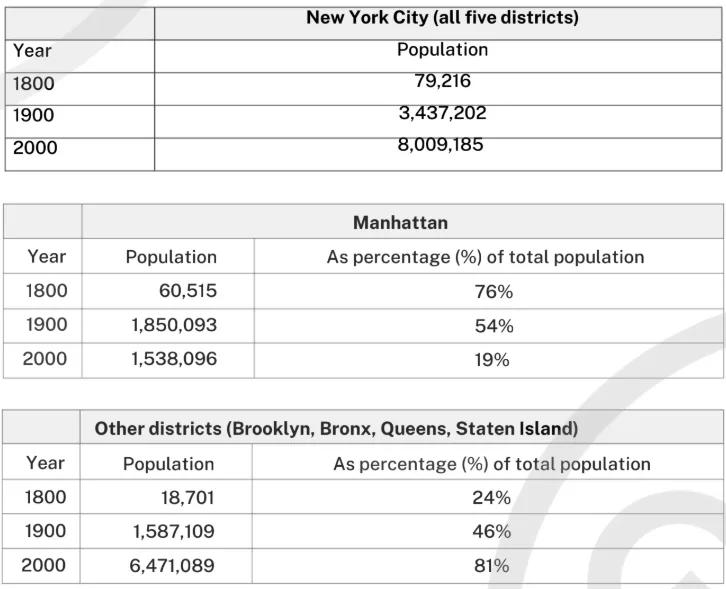
Three tables show New York City population in 1800, 1900 and 2000. The city total rises from 79,216 to 3,437,202 and then 8,009,185. Manhattan changes from 60,515, or 76 percent of the total, to 1,850,093, or 54 percent, and then 1,538,096, or 19 percent. The other four districts combined rise from 18,701, or 24 percent, to 1,587,109, or 46 percent, and then 6,471,089, or 81 percent.
Same question · Different responses
The tables illustrate how the total population of New York City and its five districts (Manhattan, Brooklyn, Bronx, Queens, and Staten Island) changed from 1800 to 2000.
TA Task AchievementCC Coherence & CohesionLR Lexical ResourceGRA Grammatical Range & Accuracy
From essays on this question
The tables illustrate how the total population of New York City and its five districts (Manhattan, Brooklyn, Bronx, Queens, and Staten Island) changed from 1800 to 2000.
Practise this question
You should spend about 20 minutes on this task. Write at least 150 words.