
IELTS Academic Writing Task 1Topic
Sport
Line graph
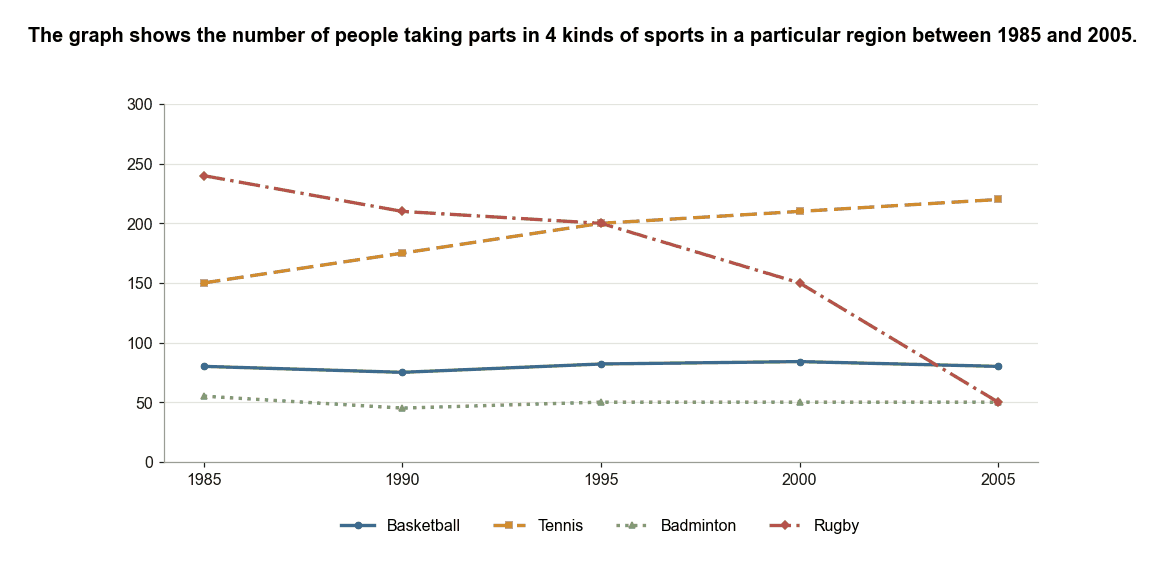
Sports Participation in a Region from 1985 to 2005
The graph shows the number of people taking parts in 4 kinds of sports in a particular region between 1985 and 2005. Summarise the information by selecting and reporting the main features, and make comparisons where relevant.
Line graph
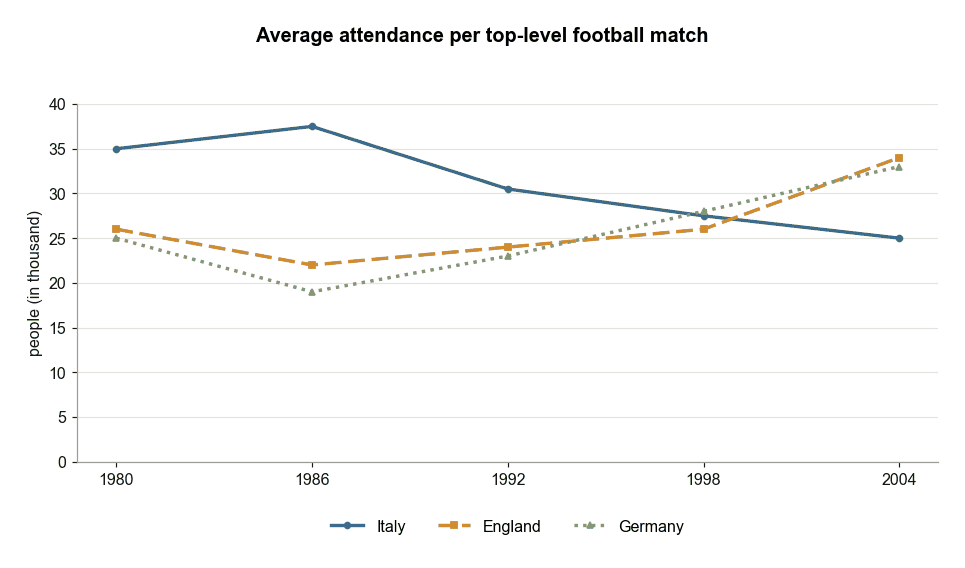
Football Match Attendance in Three European Countries
The graph below shows the average number of people attending top-level football matches in three European countries from 1980 to 2004. Summarise the information by selecting and reporting the main features, and make comparisons where relevant.