
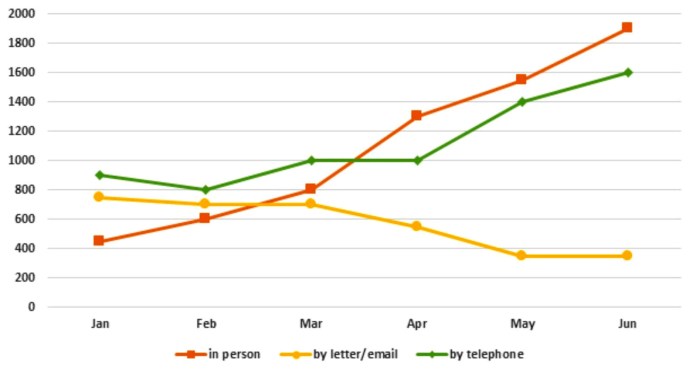
The graph demonstrates the received by the Tourist Information Office in one city over the first half of the year 2011. Overall, the received in person or by telephone each month increased over this period, whereas this figure decreased for enquiries received by letter or mail.
In January of 2011, it can be seen that enquiries in person were the fewest, at around 400 that month, compared to around 900 by telephone and 780 by letter or email. However, by June, while , to less than 400 by letter or mail.
increased every month, surpassing enquiries by letter or email for the first time in March, and enquiries by telephone for the first time in April. Meanwhile, the number of enquiries by letter or email was uniformly lower than that by telephone across the period, with the gap between the two widening from around 100 in January to more than 1200 in June.