
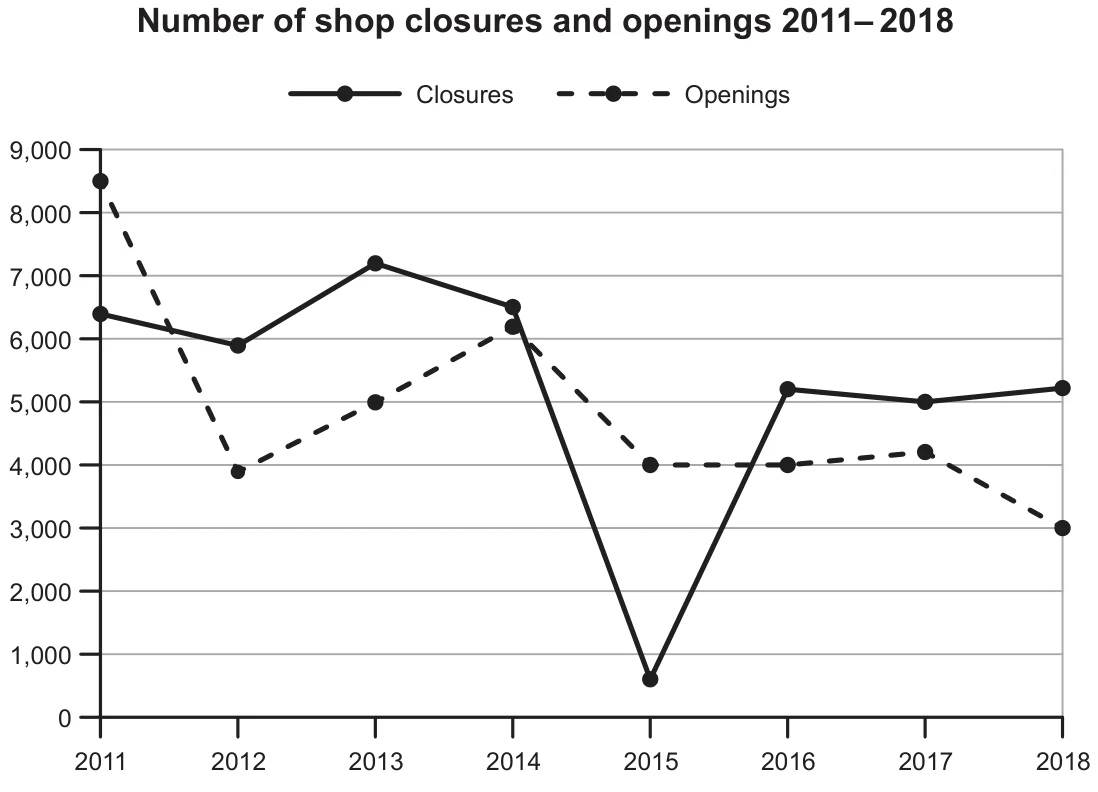
The line graph illustrates the fluctuating trends in store openings and closures within a particular country from 2011 to 2018. Overall, experienced considerable variability throughout the specified period. However, closures consistently exceeded openings every year except for 2011 and 2015.
The number of store closures oscillated between approximately 6,000 and 7,000 during the initial four years. Subsequently, there was a sharp decline in 2015, reaching a minimum of around 600. Nevertheless, this figure surged to approximately 5,000 in the and maintained this level until the end of the observed period.
In 2011, approximately 8,500 stores opened, resulting in a net increase of 2,000. Following a significant drop to 4,000 in 2012, store openings rebounded, nearly matching closure rates in 2014 at slightly over 6,000. This figure then declined again to the 2012 level in 2015, persisting until it further plummeted to an unprecedented low of 3,000 in 2018.