
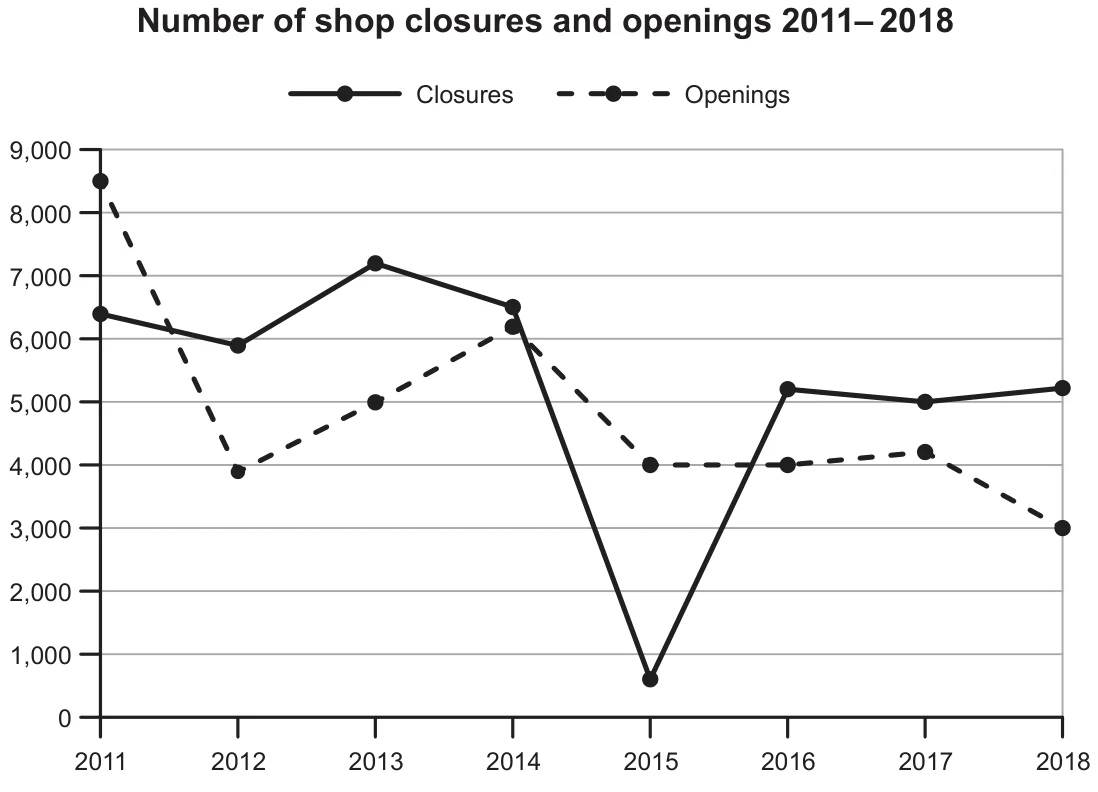
The graph illustrates the data of one country , and the number of new shops that opened. It is clear that the shop closures nose-dived in the year 2015 while the shop openings .
8,000 shops opened but a significant decline was observed in the following year. After that Meanwhile, the was slightly above 6000 in 2011, which rose to more than 7000 in the year 2013.
About 4000 shops opened in 2015, which and finally 3000 shops opened in the year 2018. On the other hand, the number of shops that shut down to below 1000 in in the as it went over 5000 in 2018.
the number of shops opened did affect the number of shops that opened and coincided in the year 2014, However, it became independent of each other in the years that followed.