
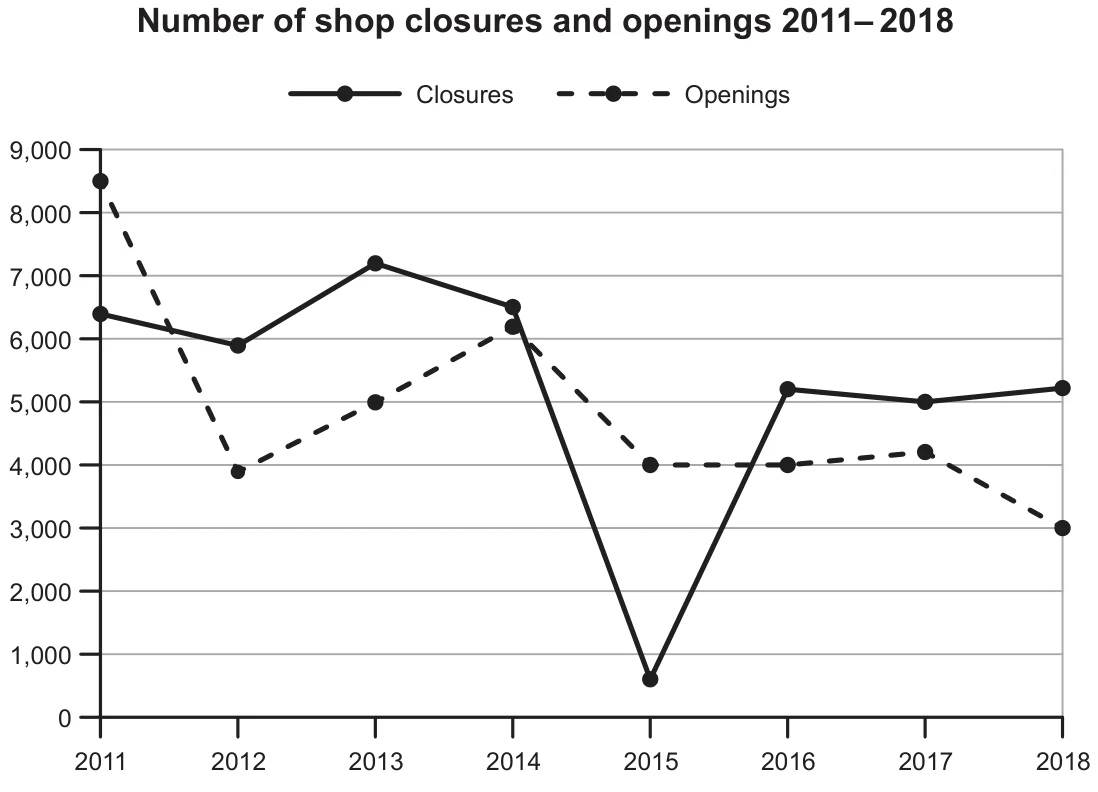
The line graph illustrates the opening and closing of shops in a particular nation from 2011 to 2018. Overall, the year 2015 marked the , while the minimum number of shop openings occurred at the end of the period. There are fluctuations in shop openings and closures, with 2015 being a significant turning point for closures, and a consistent decline observed in openings towards the end of the period.
there were in the initial year, which slightly decreased to in 2012. between 2013 and 2014. Notably, there was a significant , representing the most substantial change in the given period. Subsequently, minimal variations in shop closures were observed in the following years.
Looking at shop openings, the peak of occurred in the first year, followed by a in 2012. Despite some fluctuations, the opening of shops surpassed 6,000 in the subsequent years. However, a considerable reflected a decline in public preference. In the last two years, a was noted, reaching 3,000 shop openings in 2018.