
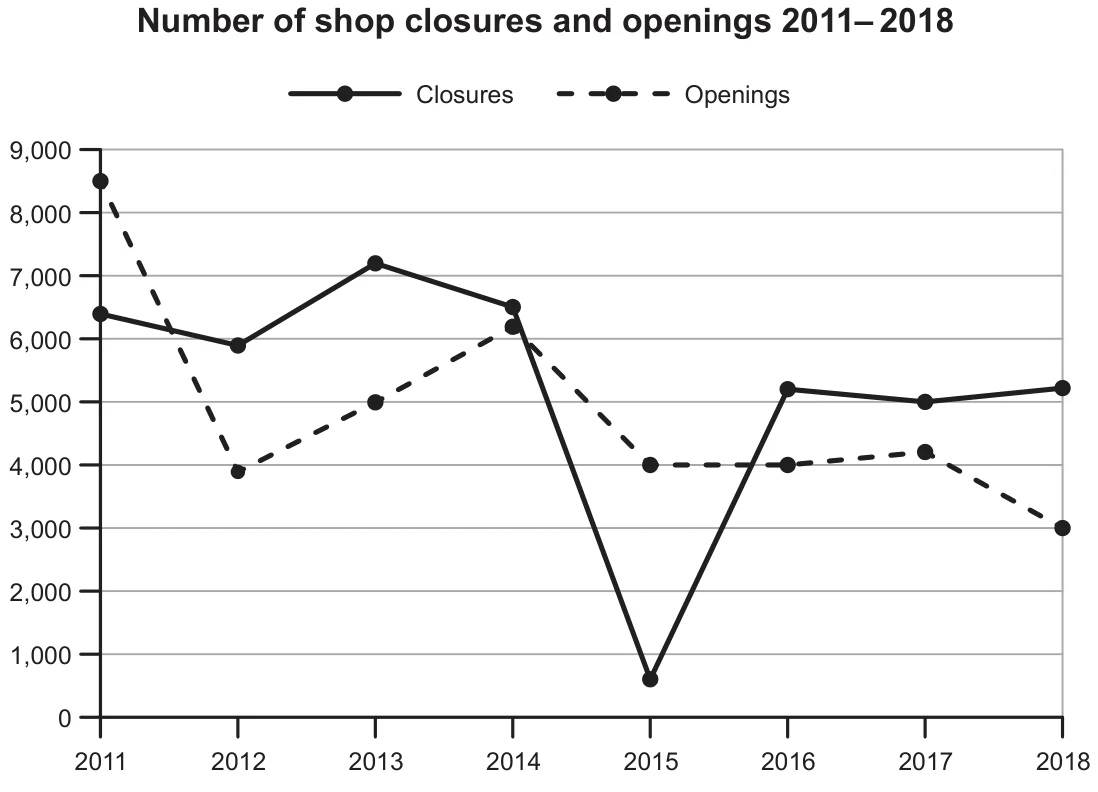
The line graph the number of shops closed and opened from 2011 to 2018. Data is calibrated into thousand.
Overall, it is crystal clear that the majority of the shops were closed in two thousand fifteen whereas the minimum opened at the end of the period.
Looking into the details, shops , in comparison, it declined slightly and reached . Likewise, the trend of closing shows fluctuations between 2013 and 2014. Interestingly, in 2018 there was a dramatic reduction witnessed by around 200, which was the greatest change in a particular country. In the following years, there was negligible difference observed towards closing shops.
Turning to the further details, in the initial year, shops , which was the peak point in the given period. While in 2012 the counting of it reduced by nearly half, then after increasing with tiny fraction and touched to above 6000. Despite this, , and . , during the two years there was an almost similar trend of opening the shops, which drop with 500 and in last year the counting of it was 3000 in 2018 in one nation.