Police Budget Sources and Spending in Britain

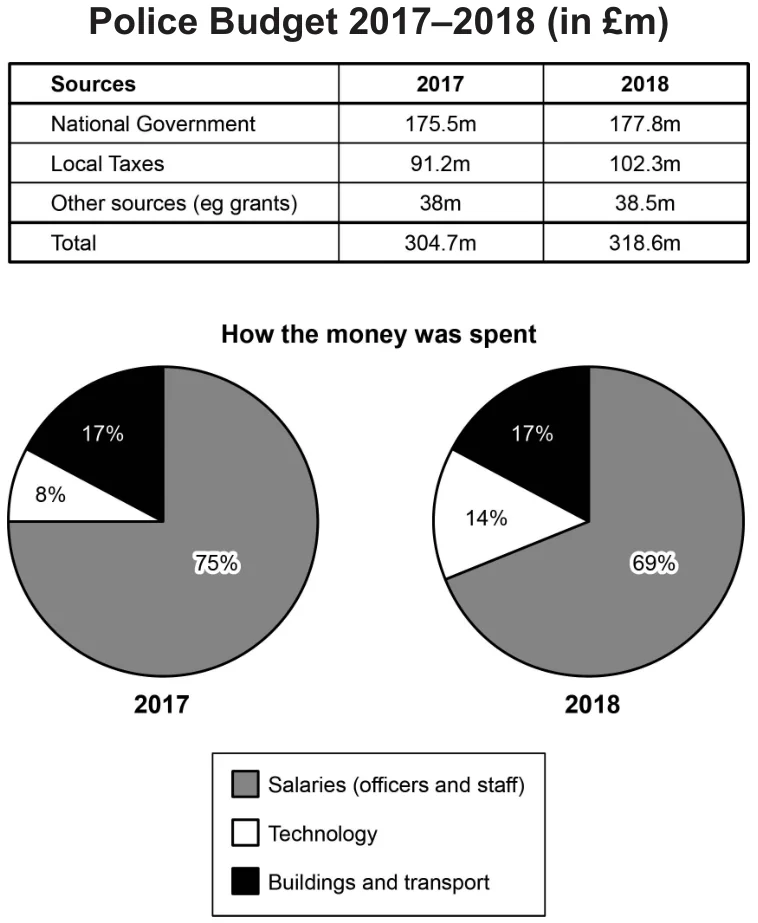
The table and charts below give information on the police budget for 2017 and 2018 in one area of Britain. The table shows where the money came from and the charts show how it was distributed. Summarise the information by selecting and reporting the main features, and make comparisons where relevant.

Cambridge IELTS 17 Academic Test 2 Writing Task 1 visual

Annotated response

8 correction notes

Showing 8 correction notes.

The table and pie charts show information about the police budget in a specific area of Britain for . The table where the money comes from, and the pie charts show how it is spent.

Overall, the police budget , and in both 2017 and 2018, the national government . Salaries were the during this time.

In 2017, the police operated with a total budget of £304.7 million, experiencing a notable increase to £318.6 million in 2018. The primary contributor to this budget was the national government, with their funding rising from £175.5 million to £177.8 million. Among all funding sources, local taxes witnessed the most substantial growth, surging from £91.2 million to £102.3 million. Additionally, other funding sources contributed £38.5 million to the overall budget in 2018, reflecting a £0.5 million increase compared to the previous year.

The main expenses were related to salaries for officers and staff, although their share decreased from 75% to 69% of the total. Notably, spending on technology nearly doubled, rising from 8% to 14%. Meanwhile, the allocation for buildings and transport remained steady at 17%.

Overall assessment

Why this response received Band 8.0

The response is a strong, accurate summary that reports all key figures from both the table and the pie charts with a clear overview and effective comparisons. Its main limitation is simply that it stays close to listing data, with slightly mechanical development in places, while language control is consistently precise throughout.

IELTS criteria

How each score was decided

Task Achievement

8.0

The response covers all key features of both visuals with accurate figures, a clear overview of the rising budget, dominant funding source, and main spending category, and relevant comparisons such as the rise in local taxes and the near doubling of technology spending.

Coherence and Cohesion

8.0

Information is organised logically into an introduction, overview, and separate body paragraphs for sources and spending, with cohesive devices and referencing used naturally throughout.

Lexical Resource

8.0

Vocabulary is flexible and precise for describing data, with appropriate phrases such as 'primary contributor', 'surging', and 'the allocation remained steady', and only minimal repetition.

Grammatical Range and Accuracy

8.0

A wide range of structures is used accurately, including participle and relative clauses and varied sentence patterns, with errors rare and non-impeding.