Electricity Production by Fuel in Australia and France

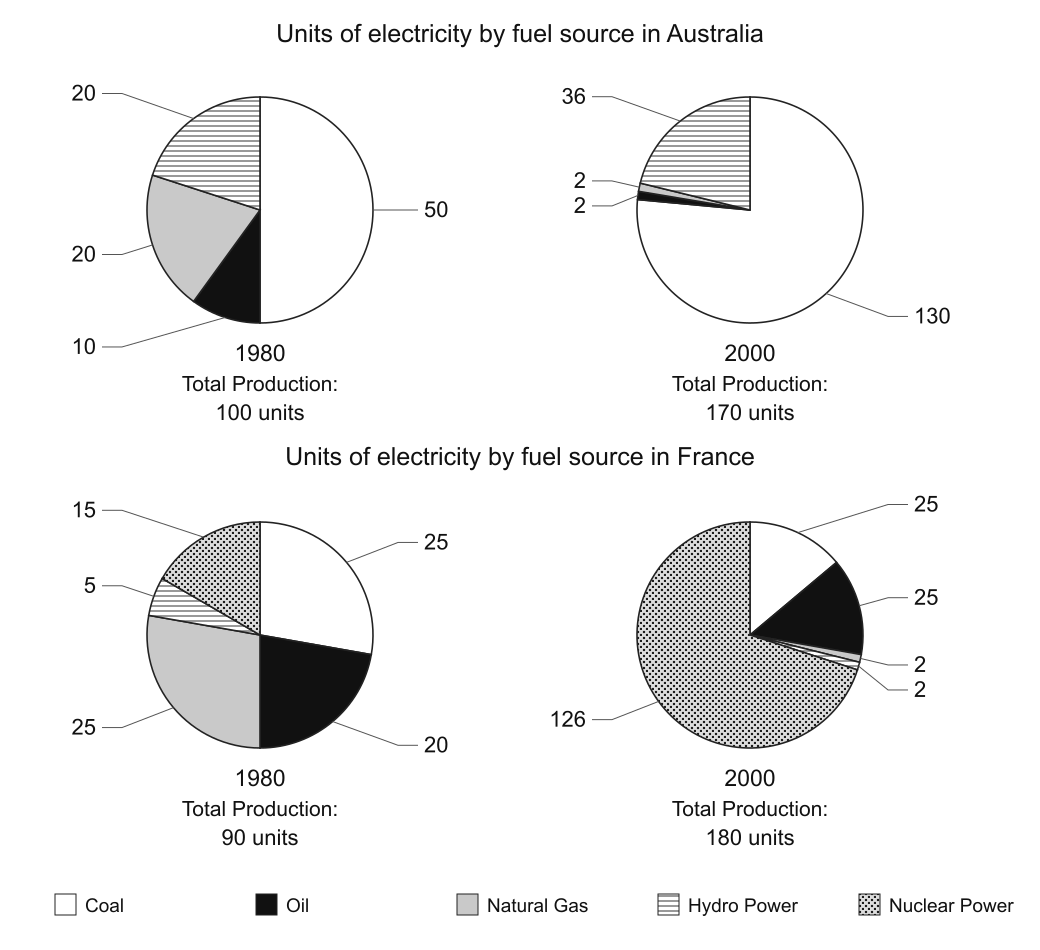
The pie charts below show units of electricity production by fuel source in Australia and France in 1980 and 2000.

IELTS Academic Writing Task 1 question image

Annotated response

14 correction notes

Showing 14 correction notes.

The chart illustrates the of units of electricity by in over the 20 years.

Overall, it is immediately apparent from the chart that the maximum units of electricity are obtained from the source of Coal in Australia, but in France, the highest unit of power was produced from nuclear power after 20 years.

To begin with, in Australia the energy was produced with the fuel of the total in 1980. Comparatively, the units after 20 years from the total of 170. following these, 20 units of power were produced from hydropower energy in the , and this amount significantly hiked with shares at 36 units from the total 170. Moreover, nuclear gas and nuclear energy sources were used in Australia in 1980. and 20 units of electricity were made and contributed around 30 units from the total of 100. unfortunately, these units drastically plummeted to 2 units of each used for current in 2000.

Furthermore, in France, all the five fuel sources were used to in 1980. followed by 25 units each built the electricity from coal oil and natural gas and after 20 years oil remained at the same value with 25% but in the case of hydropower first one and a significant amount of electricity produced in France. It is interesting to note that 15 units of with the source of nuclear power in 1980 for the first time , and that value skyrocketed with shares 126 units in 2000. Moreover, only 20 units contributed to the production of power supply by the oil in an initial year, and this ratio surged up by after 20 years.

Overall assessment

Why this response received Band 5.5

The response attempts comprehensive coverage of both countries across the two years and shows some ambition in vocabulary, particularly with change verbs. However, it is weakened by frequent data inaccuracies and misattributed fuel sources, as well as unclear phrasing and grammatical errors that obscure several comparisons.

IELTS criteria

How each score was decided

Task Achievement

5.0

The response covers both charts and years with an attempted overview, but recurring data misattributions (e.g., calling Australia's 50-unit coal share oil, describing the 130-unit coal figure as a 70-unit rise) and omission of France's totals make much of the detail inaccurate or confusing.

Coherence and Cohesion

5.5

There is a discernible overall structure with an overview and body paragraphs organised by country, but progression within paragraphs is often mechanical and some sentences, such as the reference to building 'the static', disrupt the message.

Lexical Resource

6.0

The writer attempts a range of less common vocabulary for trends ('skyrocketed', 'plummeted', 'hiked'), though some items are imprecise or misused and technical terms are occasionally conflated.

Grammatical Range and Accuracy

5.5

A mix of structures is attempted, but frequent errors in sentence construction, capitalisation, punctuation, and reference (e.g., 'the unusual year', 'after 20 years from the total of 170') reduce accuracy and occasionally obscure meaning.

Keep practising this question