Annual Overseas Visitors to Australia

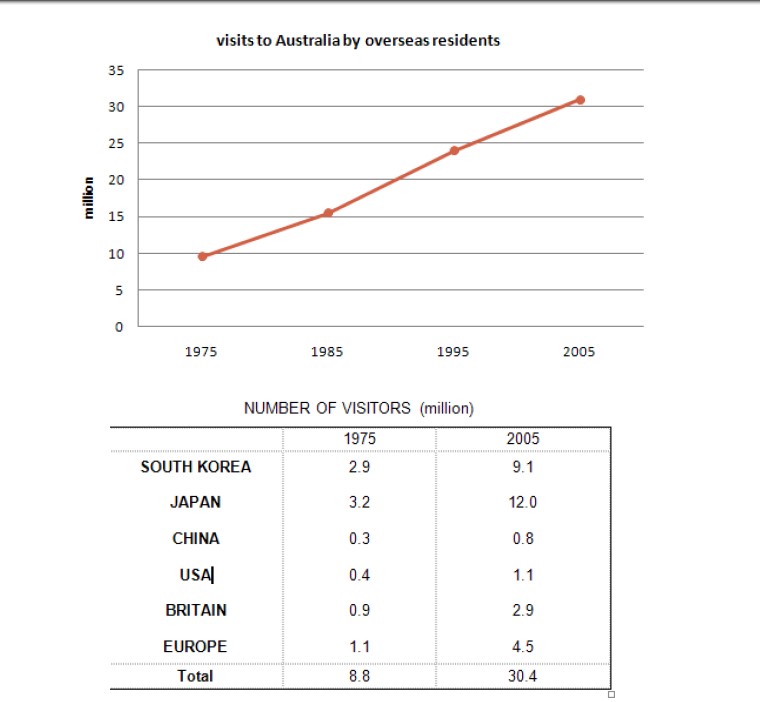
The line graph below shows the number of annual visits to Australia by overseas residents. The table below gives information on the country of origin where the visitors came from. NUMBER OF VISITORS (million) 1975 | 2005 SOUTH KOREA JAPAN CHINA USA BRITAIN EUROPE | 2.9 3.2 0.3 0.4 0.9 1.1 | 9.1 12.0 0.8 1.1 2.9 4.5 Total | 8.8 | 30.4

IELTS Academic Writing Task 1 question image

Annotated response

9 correction notes

Showing 9 correction notes.

The line graph given depicts information about to Australia (1975 -2005) by residents of other countries while the table shows the data on the of the visitors. Overall, it can be seen that visits to Australia saw an upward trend in the number of visitors yearly Residents from Japan had the highest number of visitors in 1975 and 2005, whereas China had the least no of visits to Australia.

First, the number of visitors to Australia in 1975 stood at about . Over the next 10 years, the number of visitors doubled. The visit to Australia saw an upward trend . The number of people who travelled to Australia skyrocketed to almost a 25million in 1995. There was a steady rise in the number of people that travelled to Australia over the next decade where it hit a peak at just over 30 million visitors in 2005.

On the other hand, the table shows the that visited Australia between 1975 and 2005. Japan had the highest number of visits to Australia between 1975 and 2005 at 3.2 million and 12 million respectively, followed by South Korea with the value of 2.9 million in 1975 and 9.1 million visitors in 2005. Europe, Britain, and the USA had a similar trend in ascending other in 1975 and 2005. However, China had the least number of visits to Australia. A total of 0.3 million Chinese took a tour to Australia in 1975, while 0.8 million Chinese residents visited Australia in 2005.

Overall assessment

Why this response received Band 7.0

The response covers both visuals well, with a clear overview, accurate figures, and logical two-part paragraphing supported by some effective vocabulary such as 'skyrocketed' and 'hit a peak'. The main limitation is a handful of imprecise or awkward expressions, including 'originality' instead of 'origin', 'between 1985 to 1995', and the vague phrase 'in ascending other in', alongside minor data rounding such as 'about 8 million' for 8.8 million.

IELTS criteria

How each score was decided

Task Achievement

7.0

The response presents a clear overview of the upward trend and the highest and lowest countries, selects and reports most key figures accurately from both visuals, though one value is rounded away from the table's 8.8 million and the description of Europe, Britain and the USA is somewhat vague.

Coherence and Cohesion

7.0

Paragraphing is logical and progression through the line graph then the table is clear, supported by cohesive devices such as 'Overall', 'First' and 'On the other hand', though some phrases like 'in ascending other in' reduce clarity locally.

Lexical Resource

7.0

Vocabulary is generally flexible and appropriate, including items like 'saw an upward trend' and 'hit a peak', with occasional imprecise choices such as 'originality' for 'origin' and 'the least no of visits'.

Grammatical Range and Accuracy

7.0

A range of sentence structures is used with mostly accurate control, but there are recurring minor grammatical and prepositional errors, including 'between 1985 to 1995' and inconsistent article use.

Keep practising this question