
雅思写作考生回忆
2026年11月雅思写作机经:近期真题回忆
考生考后回忆、近 4 周内报告的雅思写作大作文和A类小作文题目,按周分组,部分题目附范文和带分数的批改。更新于2026年11月19日。
这些题目如何核实
- 近期多次出现
- 近 3 个月里,考生在至少两个不同日期的考试后报告过这道题。“依据”里列出每次报告的考试日期和对应记录。
- 老题
- 这道题在 3 个月以前就出现过:更早的考生报告、有日期的公开记录,或剑桥雅思官方真题集。标签后面是剑桥册数或最早年份。
- 无标签
- 目前只报告过一次。本页每道题在所示时间段内都至少有一位考生报告过。
近期雅思写作大作文真题
11月16日 – 11月19日
2道题
父亲是否应享有陪产假
Paternity Leave for Fathers at ChildbirthAll fathers should be entitled to time off work when their child is born. To what extent do you agree or disagree?
经济之外衡量国家成功的因素
Measuring a Country's Success Beyond Economic ProgressEconomic progress is one way to measure a country's success. Some people believe that there are other factors that should be considered when measuring the success of a country. What are the other factors? Do you think there is a factor that is more important than the others?
11月9日 – 11月15日 当周
6道题
把钱花在太空探索技术上
Spending Money on Space Exploration TechnologySome people believe that spending money on developing technology for space exploration is not justifiable and that there are more beneficial ways to spend this money. To what extent do you agree or disagree?
是否应要求青年从事无偿社区工作
Compulsory Unpaid Community Work for Young AdultsIt has been suggested that all young adults should be required to undertake a period of unpaid work helping people in the community. Would the drawbacks of such a requirement be greater than the benefits to the community and the individual young people?
收入全归自己还是向国家纳税
Keeping All Earnings vs Paying Taxes to the StateSome people believe that they should be able to keep all the money they earn, and should not have to pay tax to the state. To what extent do you agree or disagree?
互联网公司掌握个人信息的利弊
Personal Information Held by Internet CompaniesThe personal information of many individuals is held by large internet companies and organizations. Do you think the advantages of this outweigh the disadvantages?
为日常活动在网上提供个人信息
Sharing Personal Information Online for Everyday ActivitiesToday more people put personal and private information online (address, phone number and credit card number) do everyday activities such as banking, shopping. Is this a positive or negative development?
University students always focus on one specialist subject, but some people think universities should encourage their students to study a range of subjects in addition to their own subject. To what extent do you agree or disagree?
大学生总是专注于一门专业学科,但有些人认为,大学应该鼓励学生在学习本专业之外,还学习一系列其他学科。你在多大程度上同意或不同意?11月2日 – 11月8日 当周
6道题
博物馆和历史遗迹主要吸引游客
Museums and Historical Sites Visited Mainly by TouristsMany museums and historical sites are mainly visited by tourists, not local people. Why is this the case? What can be done to attract local people?
语言学习中的班级规模
Class Size in Language LearningSome people think that language should be taught in small classes, while other people think the number of students in a language class does not matter. Discuss both views and give your opinion.
动物物种灭绝是自然过程,人类无需阻止
Preventing Animal Species Extinction as a Natural ProcessIt is a natural process for animal species to become extinct (e.g dinosaurs, dodos, etc.). There is no reason why people should try to prevent this from happening. To what extent do you agree or disagree?
全球食物浪费的原因与解决办法
Causes and Solutions for Global Food WasteEvery day, millions of tons of food are wasted all over the world. Why do you think this is happening? And how can we solve this problem?
做一名负责任的游客是否可能
Possibility of Being a Responsible TouristIn recent years, tourists have paid attention to preserving both the culture and environment of the places they visit. However, some people think that it is impossible to be a responsible tourist. To what extent do you agree or disagree with this opinion?
人类为自身利益利用动物
Using Animals for Human BenefitSome people think that humans can use animals for their benefit. Others believe that this practice is wrong. Discuss both views and give your own opinion.
10月26日 – 11月1日 当周
5道题
共享媒体使国家间差异变得不那么明显
Shared Media Making Differences Between Countries Less EvidentNowadays the differences between countries are becoming less evident because people follow the same media. Do the advantages of this trend outweigh the disadvantages?
家庭价值观还是学校知识更影响成功
Family Values vs School Knowledge for Future SuccessThe values that we learn from our parents and family have a greater influence on our future success than knowledge and skills we learn at school. To what extent do you agree or disagree?
艺术人人可创作还是只属于有天赋者
Can Art Be Made by Everyone or Talented PeopleSome people say that art (e.g. painting, music, poetry) can be made by everyone whereas others believe that it can be only made by those with special abilities. Discuss both views and give your opinion.
学生是否应承担全部大学费用
Students Paying Full Cost of University EducationStudents should pay the full cost for their own study, because university education benefits individuals rather than society. To what extent do you agree or disagree?
广告是否会影响购物决定
Whether Advertisements Influence Shopping DecisionsSome people find advertisements amusing or annoying and they are not influenced by this when they shop. To what extent do you agree or disagree?
10月23日 – 10月25日
4道题
大学入学竞争日益激烈
Increasing Competition for University PlacesCompetition for university study is becoming increasingly strong. Why are universities becoming more competitive? Is this a positive or negative development?
是否应鼓励儿童通过看电视学习
Encouraging Children to Watch Television to LearnChildren can learn effectively by watching television. Therefore they should be encouraged to watch television both at home and at school. To what extent do you agree or disagree?
现场观看演出与在家看电视转播
Live Performances vs Watching on TelevisionThere is no need to attend a live performance (e.g. a play or concert) because seeing it at home on television is better. To what extent do you agree or disagree?
In many parts of the world, children and teenagers are committing more crimes. Why is this happening? How should children or teenagers be punished?
在世界许多地区,儿童和青少年犯罪越来越多。为什么会出现这种情况?应该如何惩罚儿童或青少年?近期雅思写作A类小作文真题
11月16日 – 11月19日
2道题
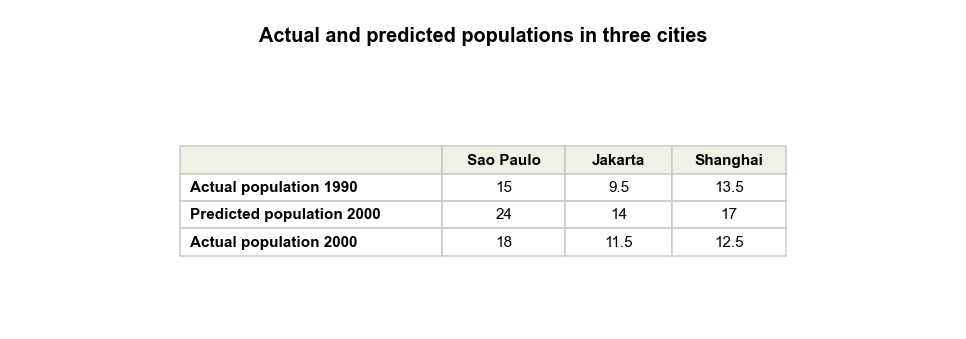
三座城市的实际与预测人口
Actual and Predicted Populations in Three CitiesThe table below compares actual and predicted figures for populations in three different cities. Summarise the information by selecting and reporting the main features, and make comparisons where relevant.
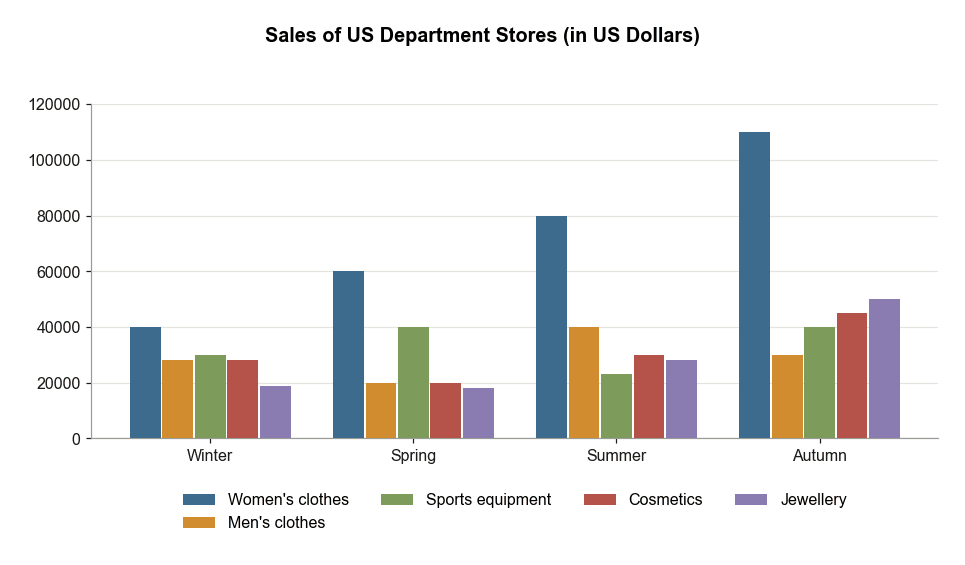
The graph below shows the sales of five types of items in four different seasons at a departmental store in the US in 2011.
下图展示了2011年美国一家百货商店五类商品在四个不同季节的销售情况。11月9日 – 11月15日 当周
7道题
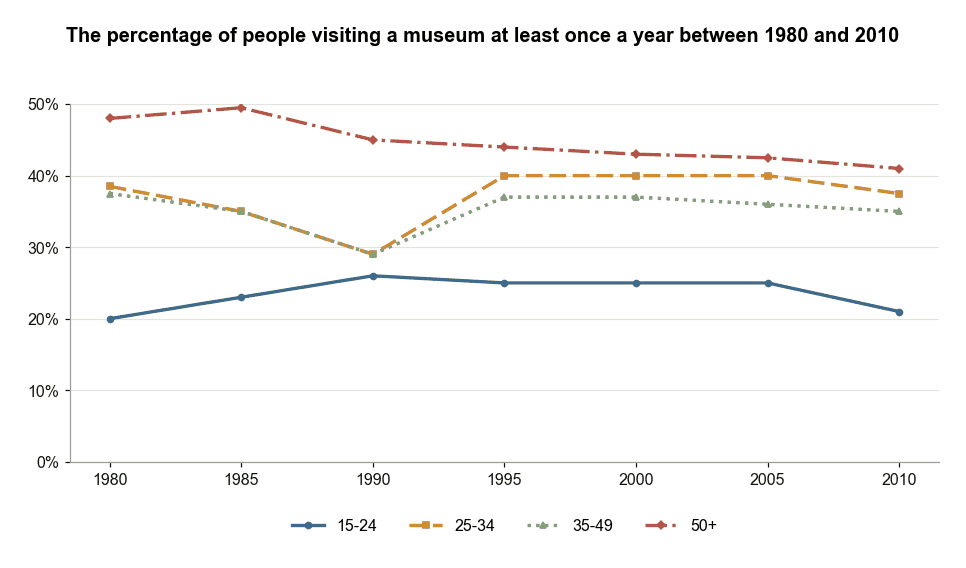
各年龄组1980年至2010年的博物馆参观率
Museum Visits by Age Group Between 1980 and 2010The graph below shows the percentage of people visiting a museum at least once a year between 1980 and 2010. Summarise the information by selecting and reporting the main features, and make comparisons where relevant.
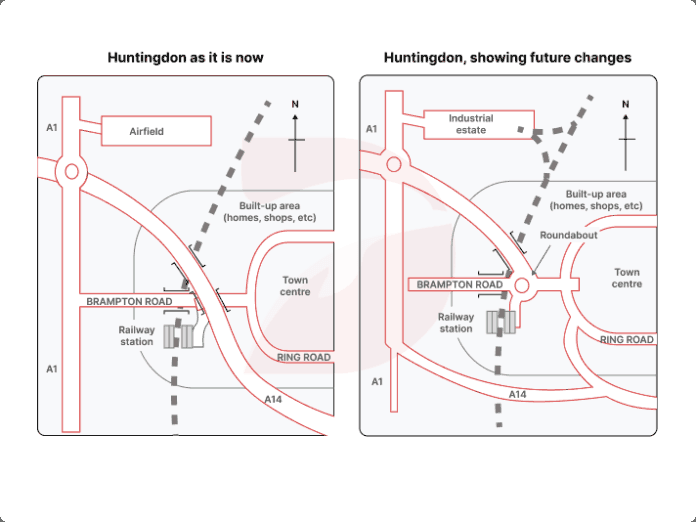
Huntingdon 现状与未来规划图
Huntingdon Present and Future MapsThe maps below show Huntingdon as it is now, and how it will change in the future. Summarise the information by selecting and reporting the main features, and make comparisons where relevant.
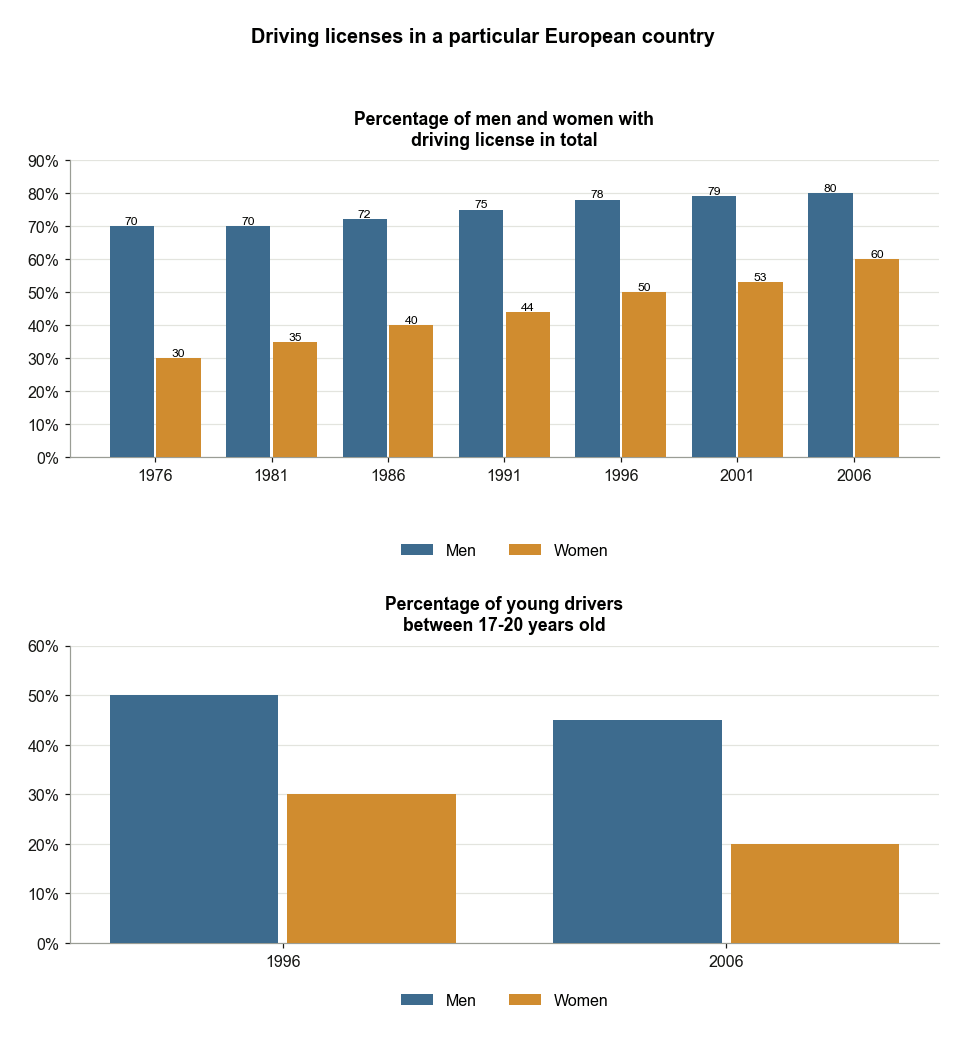
欧洲某国男女驾照持有比例
Driving Licenses by Gender in a European CountryThe bar charts below show information (the percentage of males and females with driving licenses in total; the percentage of young drivers between 17 and 20 years old) about driving licenses in a particular European country. Summarise the information by selecting and reporting the main features, and make comparisons where relevant.
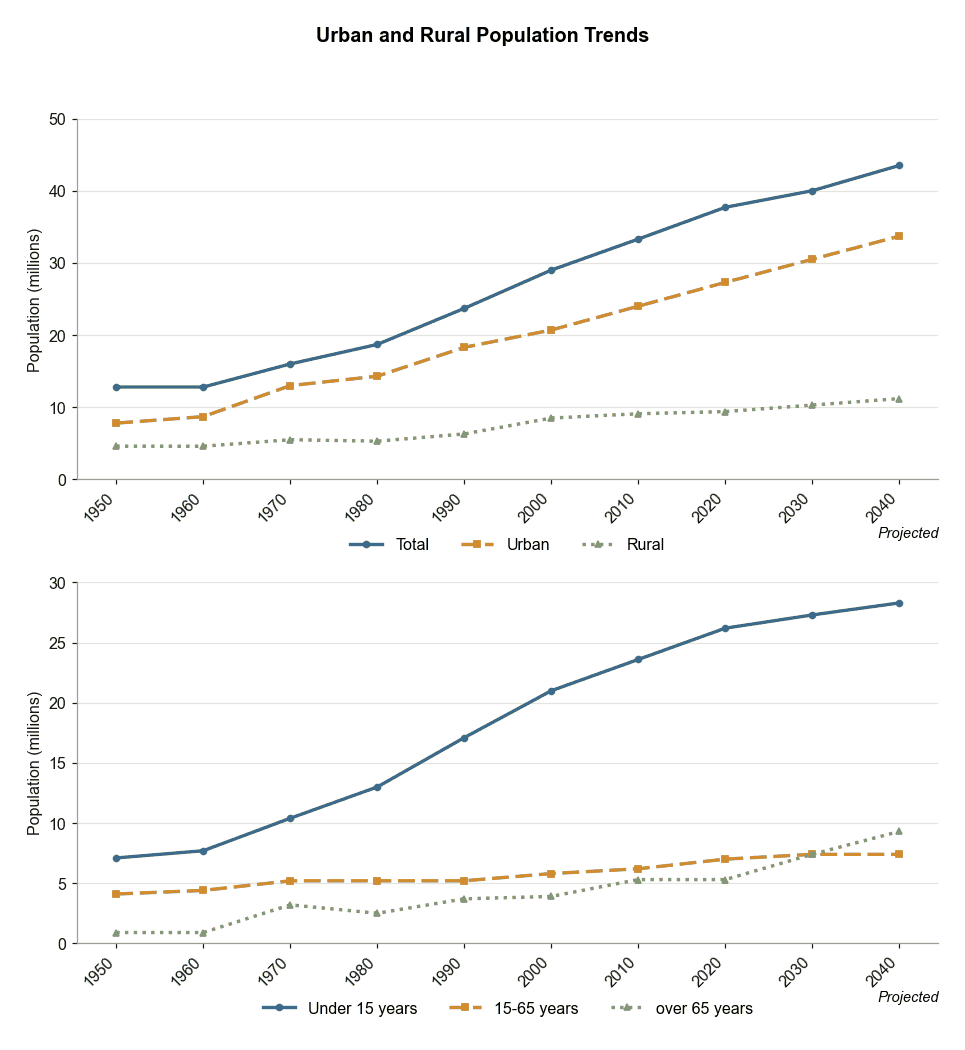
南太平洋国家的人口变化趋势
Population Trends in Southern Pacific CountriesThe graphs below illustrate trends in population in Southern Pacific Ocean countries from 1950, with projections up to 2040. Summarise the information by selecting and reporting the main features, and make comparisons where relevant.
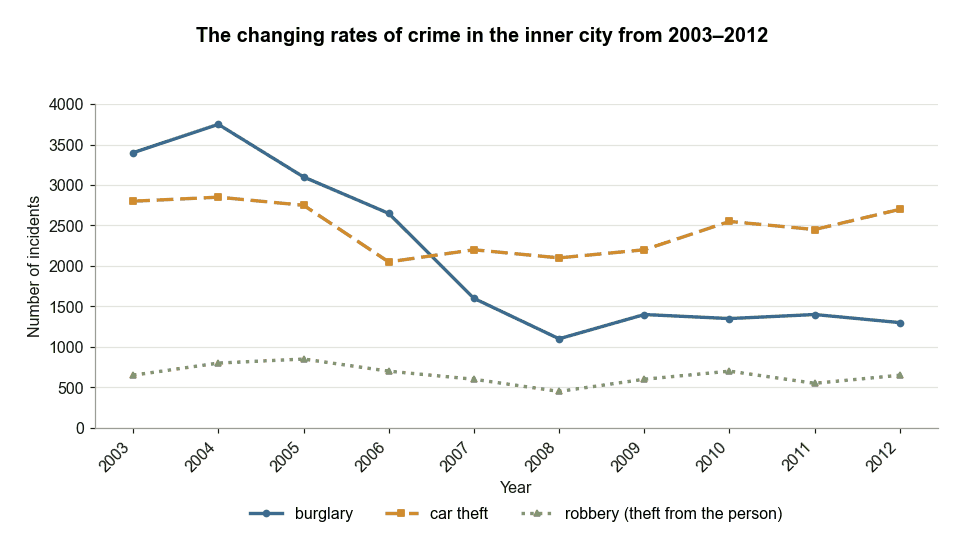
2003–2012年纽波特市中心犯罪变化
Crime Rates in Newport City Centre 2003-2012The chart below shows the changes that took place in three different areas of crime in Newport city centre from 2003-2012. Summarise the information by selecting and reporting the main features, and make comparisons where relevant.
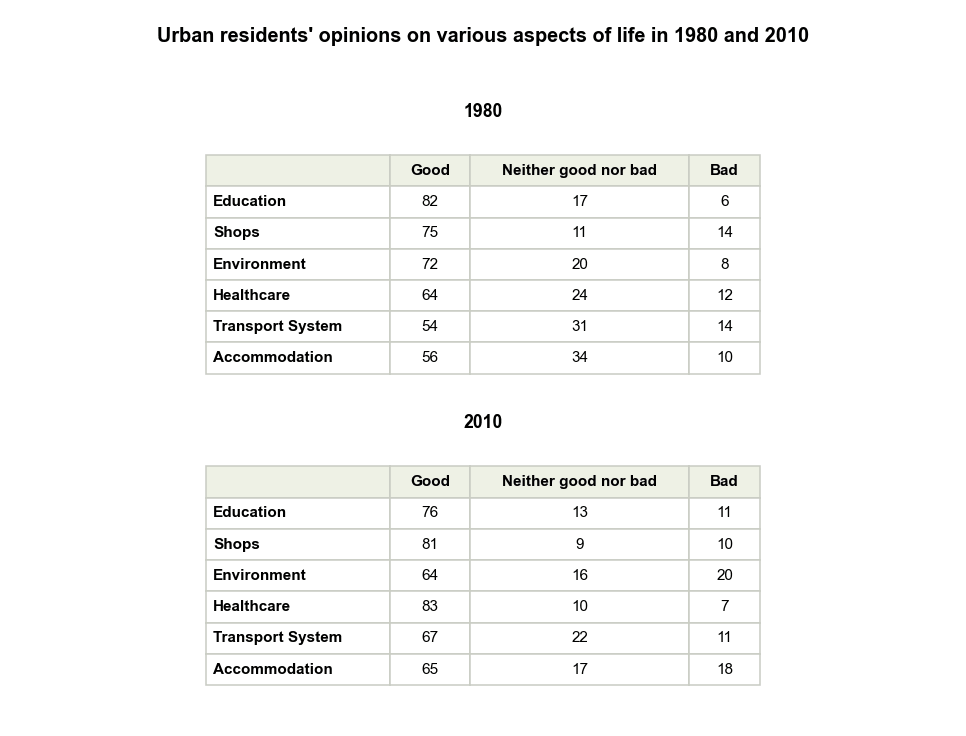
The tables below show the results of a survey of urban residents' opinions related to various aspects of life in 1980 and 2010.
下列表格展示了1980年和2010年一项关于城市居民对生活各方面看法的调查结果。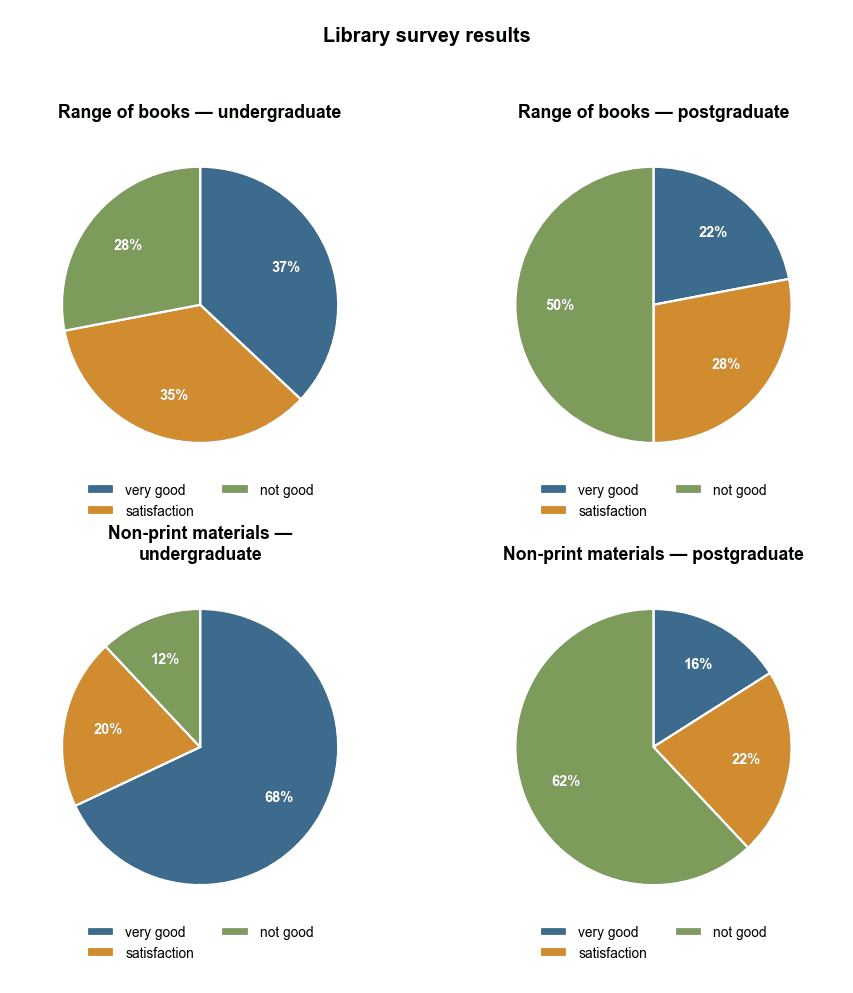
The pie charts show the results of a survey in which undergraduates and postgraduates were asked about the range of books and non-printed materials in their school library.
这些饼图展示了一项调查的结果,该调查询问了本科生和研究生对其学校图书馆中图书及非印刷资料种类的看法。11月2日 – 11月8日 当周
6道题
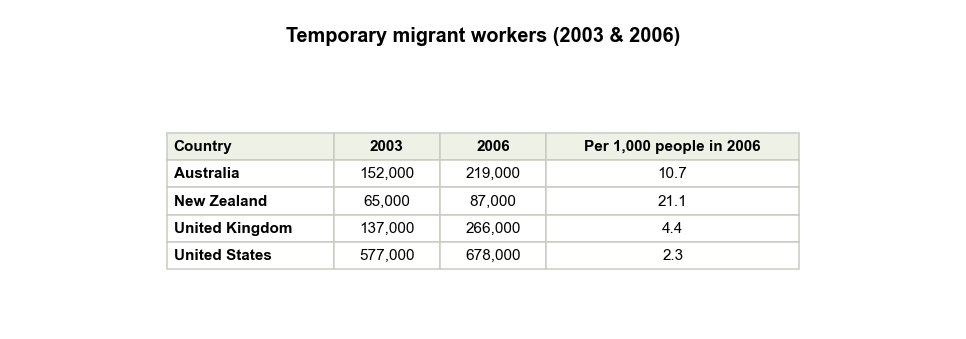
四国临时外籍劳工人数表
Temporary Migrant Workers in Four Countries TableThe table below shows the number of temporary migrant workers in four countries in 2003 and 2006 and the number of these workers per 1,000 people in these countries in 2006. Summarise the information by selecting and reporting the main features, and make comparisons where relevant.
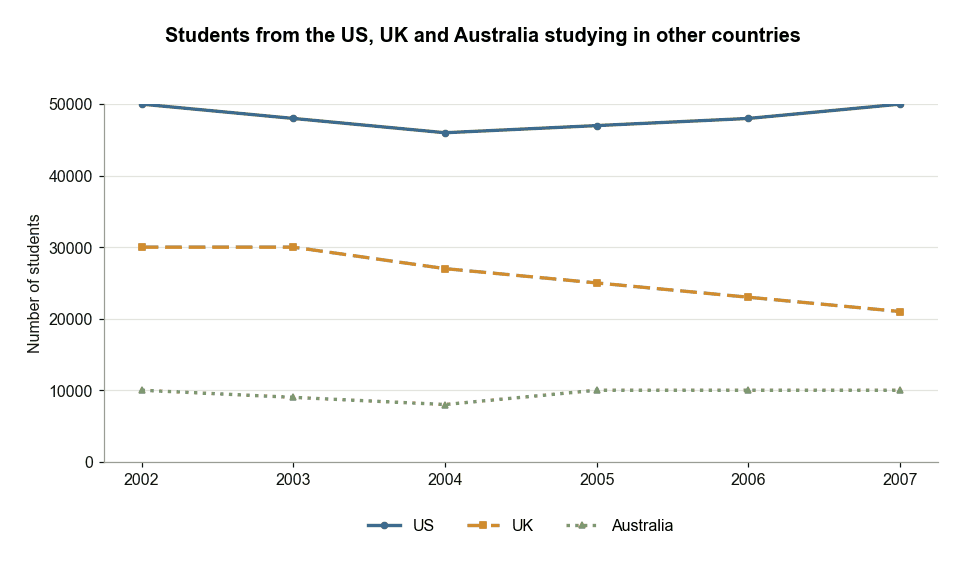
美英澳三国出国留学人数
Students from US, UK and Australia Studying AbroadThe graph below provides information on the number of students from the US, UK and Australia who studied in other countries between 2002 and 2007. Summarise the information by selecting and reporting the main features, and make comparisons where relevant.
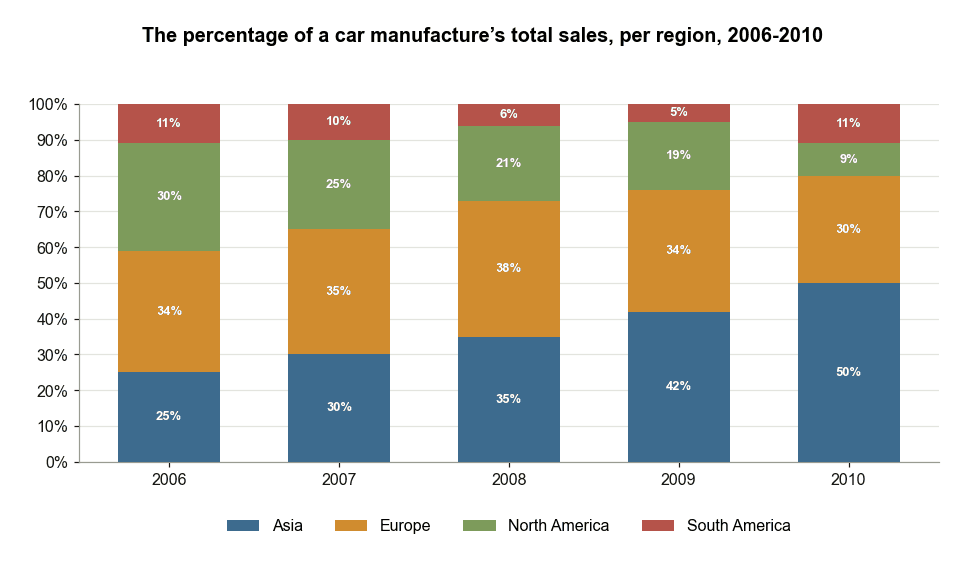
汽车制造商2006年至2010年分地区销量
Car Manufacturer Sales by Region 2006 to 2010The chart below shows the percentage of a car manufacturer’s total sales in various regions from 2006 to 2010. Summarise the information by selecting and reporting the main features, and make comparisons where relevant.
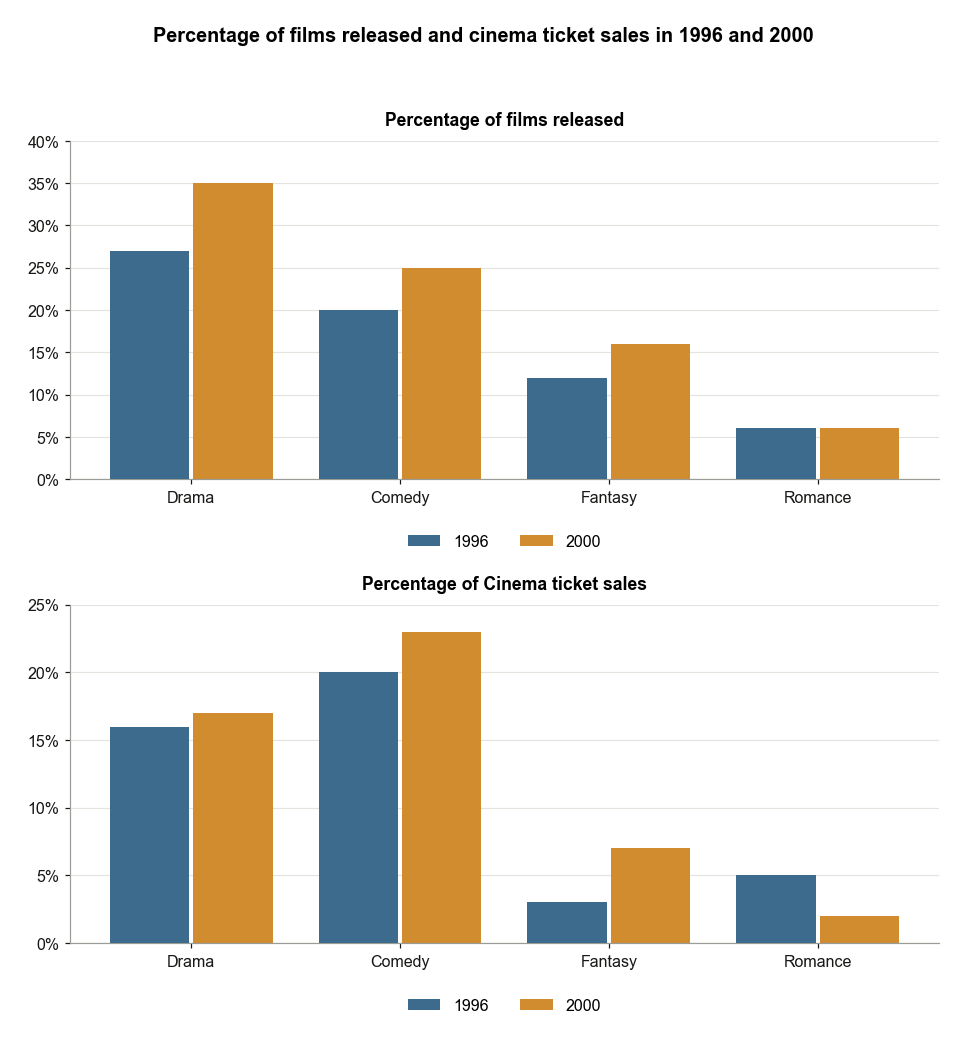
1996年与2000年电影发行量和票房占比
Films Released and Ticket Sales in 1996 and 2000The graphs below show the total percentage of films released and the total percentage of ticket sales in 1996 and 2000 in a country. Summarise the information by selecting and reporting the main features, and make comparisons where relevant.
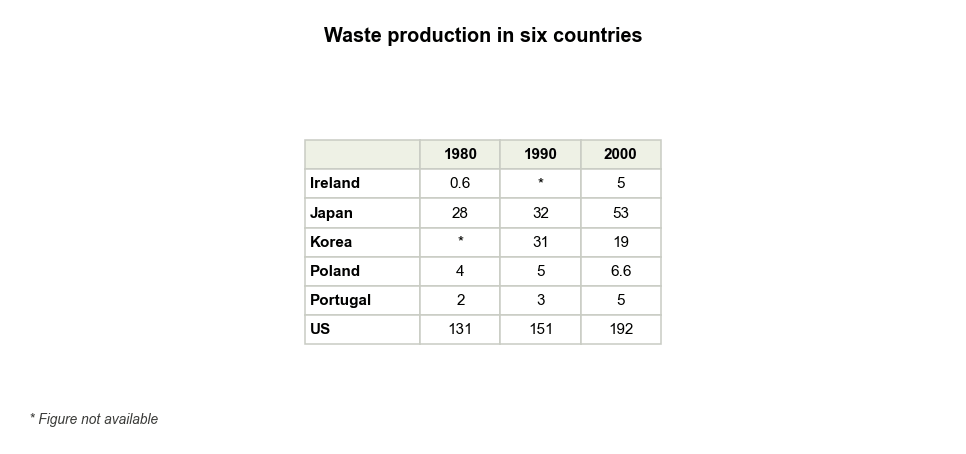
六国废弃物产生量表
Waste Production in Six Countries TableThe table below shows the amount of waste production (in millions of tonnes) in six different countries over a twenty-year period. Summarise the information by selecting and reporting the main features, and make comparisons where relevant.
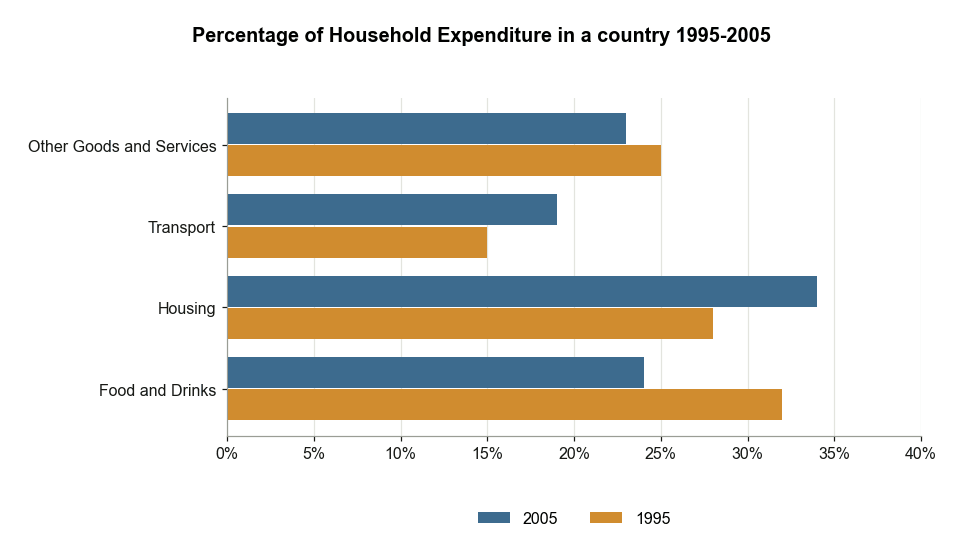
The chart shows the percentage of household expenditure on goods and services in a country from 1995 to 2005.
这幅图表显示了1995年至2005年某国家庭在商品和服务上的支出百分比。10月26日 – 11月1日 当周
5道题
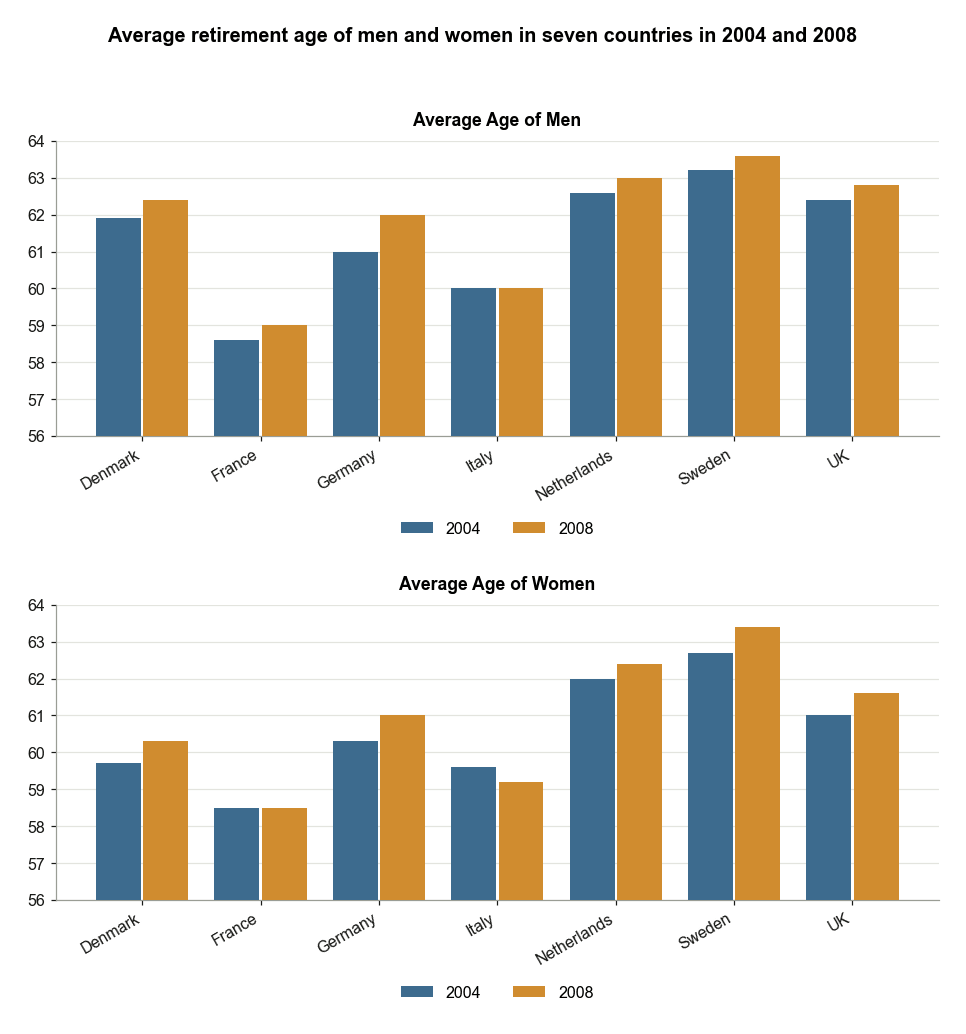
七个国家的平均退休年龄
Average Retirement Age in Seven CountriesThe charts below show average age of men and women who retired from work in seven countries in 2004 and 2008. Summarise the information by selecting and reporting the main features, and make comparisons where relevant.
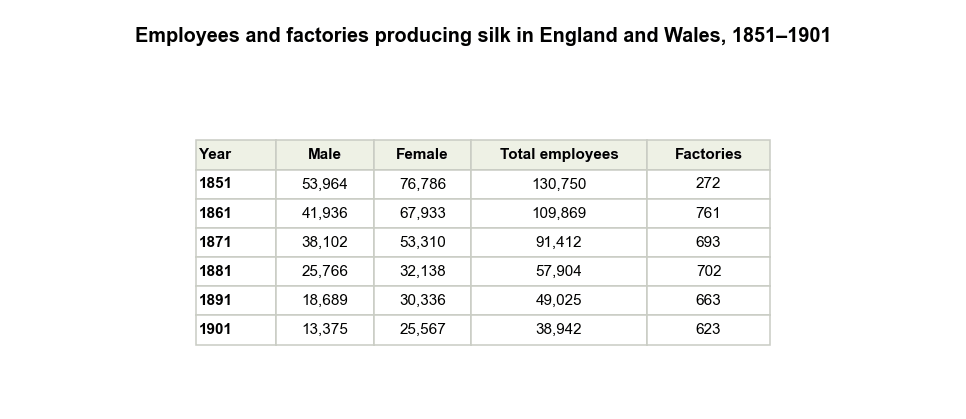
英格兰和威尔士丝绸业员工与工厂数量
Silk Industry Employees and Factories in England and WalesThe table shows the number of employees and factories producing silk in England and Wales between 1851 and 1901. Summarise the information by selecting and reporting the main features, and make comparisons where relevant.
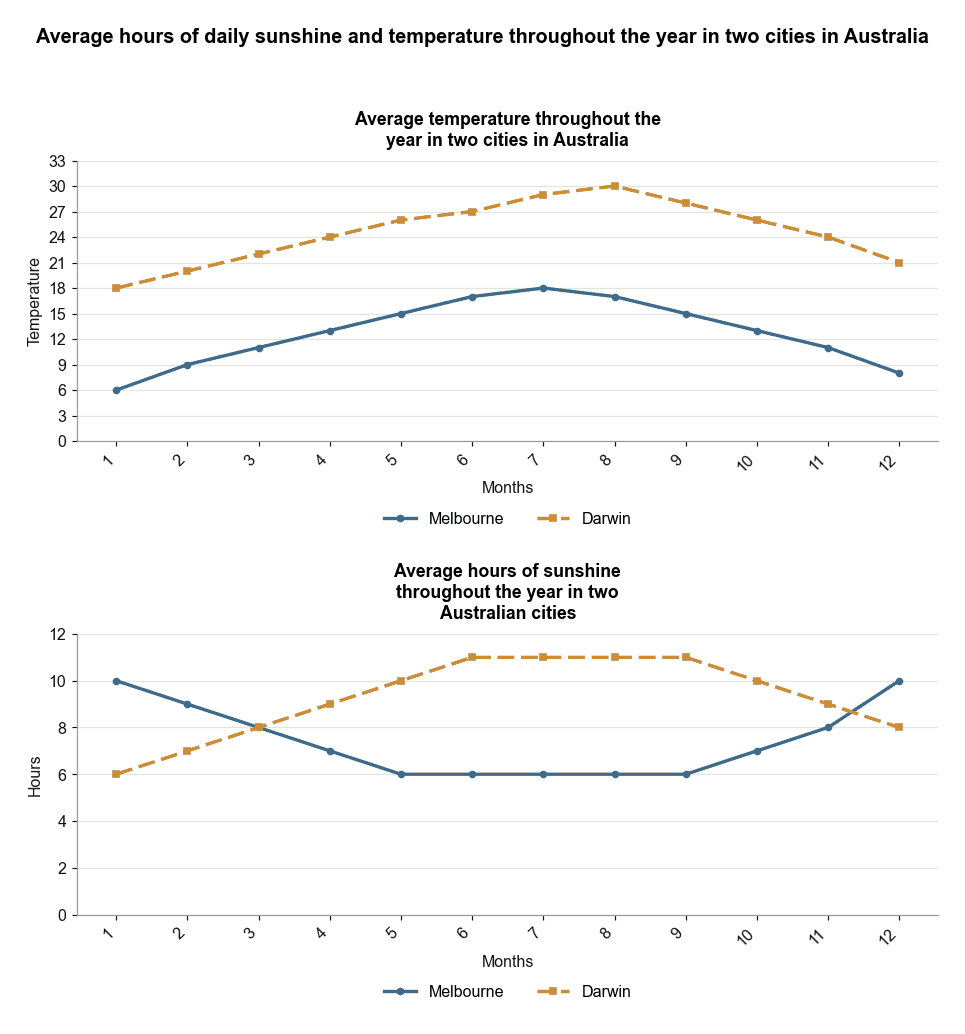
The graphs below show the average hours of daily sunshine and temperature throughout the year in two cities in Australia.
下列图表显示了澳大利亚两个城市全年的平均每日日照时数和气温。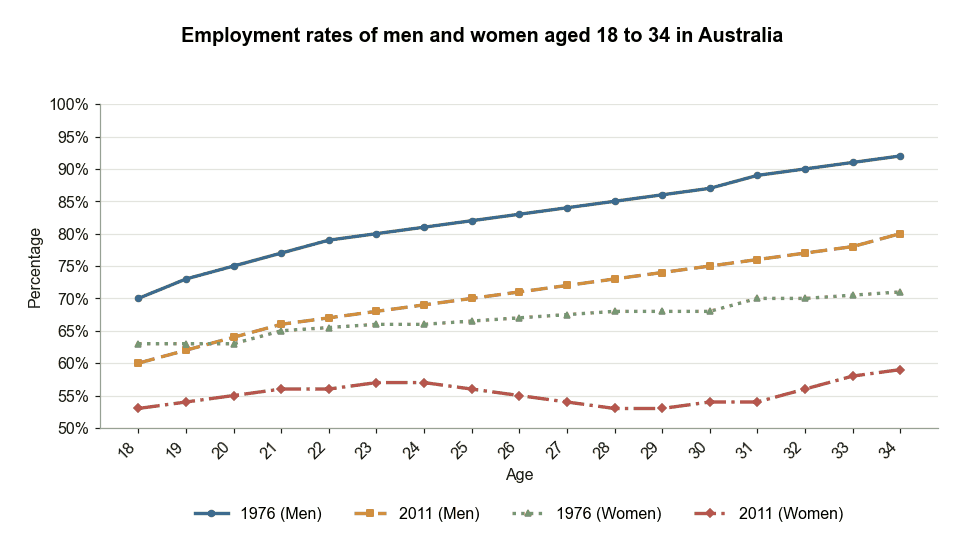
The graph below illustrates the relationship between the employment rates of men and women aged 18 to 34 in Australia from 1976 to 2011.
下面的图表说明了1976年至2011年澳大利亚18至34岁男性和女性就业率之间的关系。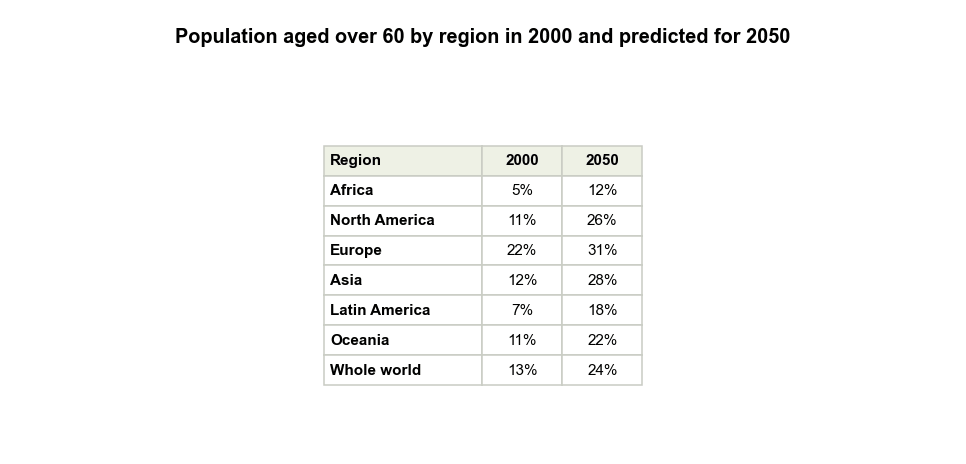
The table below gives information about the population of people over 60 in six regions in 2000, and the predicted population over 60 in 2050. It also shows the world population over 60 in 2000 and 2050.
下表提供了2000年六个地区60岁以上人口数量的信息,以及2050年60岁以上人口数量的预测数据。表中还显示了2000年和2050年全球60岁以上人口的数量。10月23日 – 10月25日
5道题
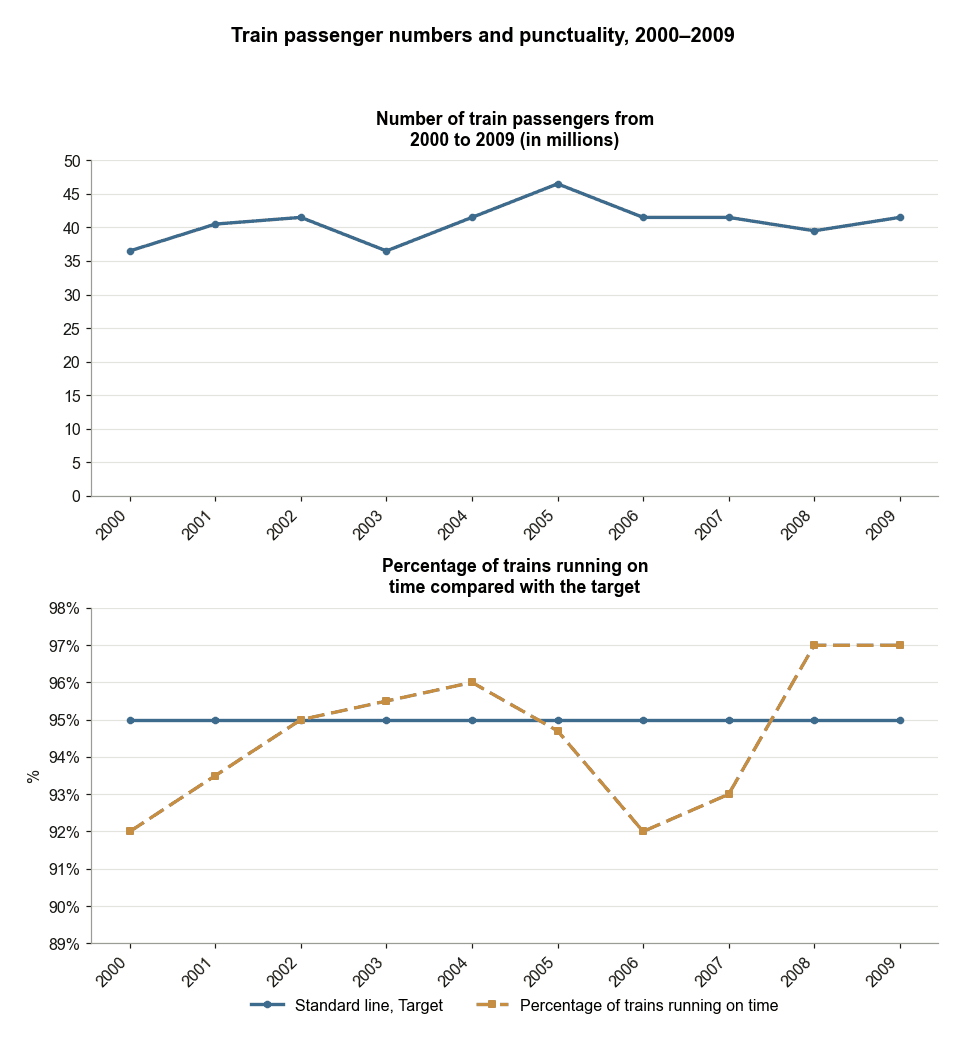
2000至2009年火车乘客量与准点率
Train Passenger Numbers and Punctuality 2000–2009The first graph shows the number of train passengers from 2000 to 2009. The second graph shows the percentage of trains running on time. Summarise the information by selecting and reporting the main features, and make comparisons where relevant.
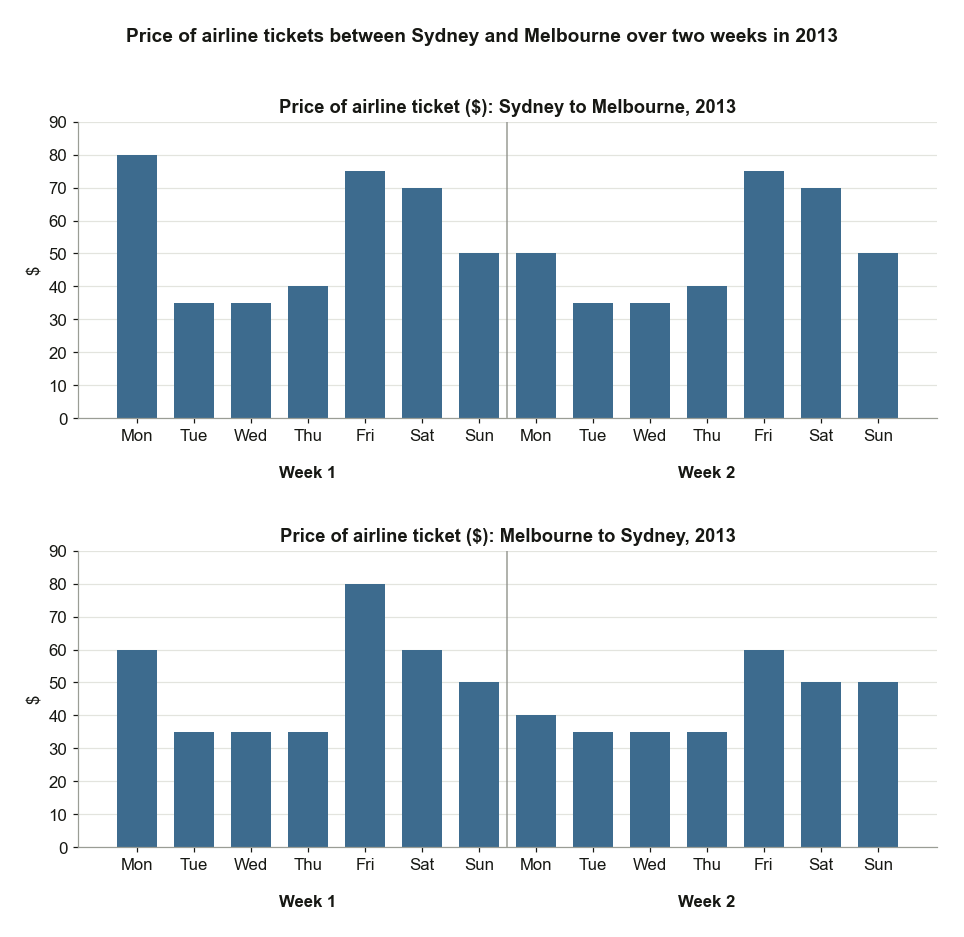
2013年悉尼与墨尔本之间的机票价格
Airline Ticket Prices Between Sydney and Melbourne in 2013The charts below give information about the price of tickets on one airline between Sydney and Melbourne, Australia, over a two-week period in 2013. Summarise the information by selecting and reporting the main features, and make comparisons where relevant.
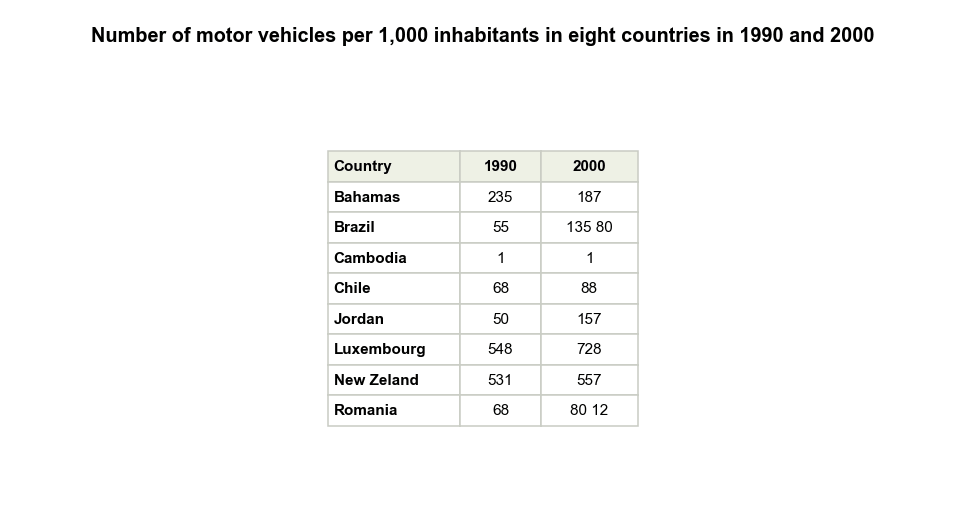
八国每千名居民的机动车数量
Motor Vehicles per 1,000 Inhabitants in Eight CountriesThe table below shows the number of motor vehicles per 1,000 inhabitants in eight countries in 1990 and 2000. Summarise the information by selecting and reporting the main features, and make comparisons where relevant.
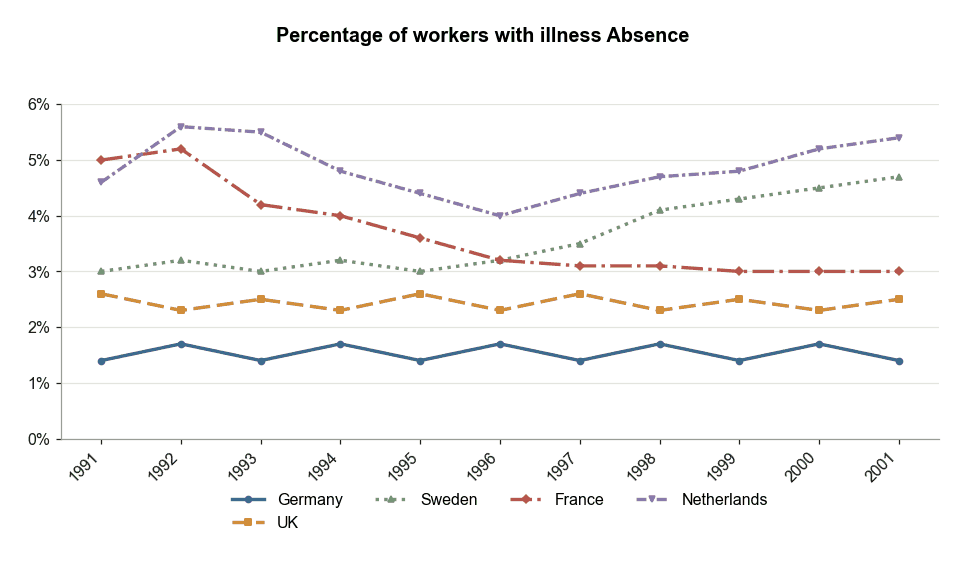
The graph below shows the percentage of workers from five different European countries taking five days or more sickness absences per year from 1991 to 2001.
下图显示了1991年至2001年间五个不同欧洲国家的工人中,每年因病缺勤5天或以上的人所占的百分比。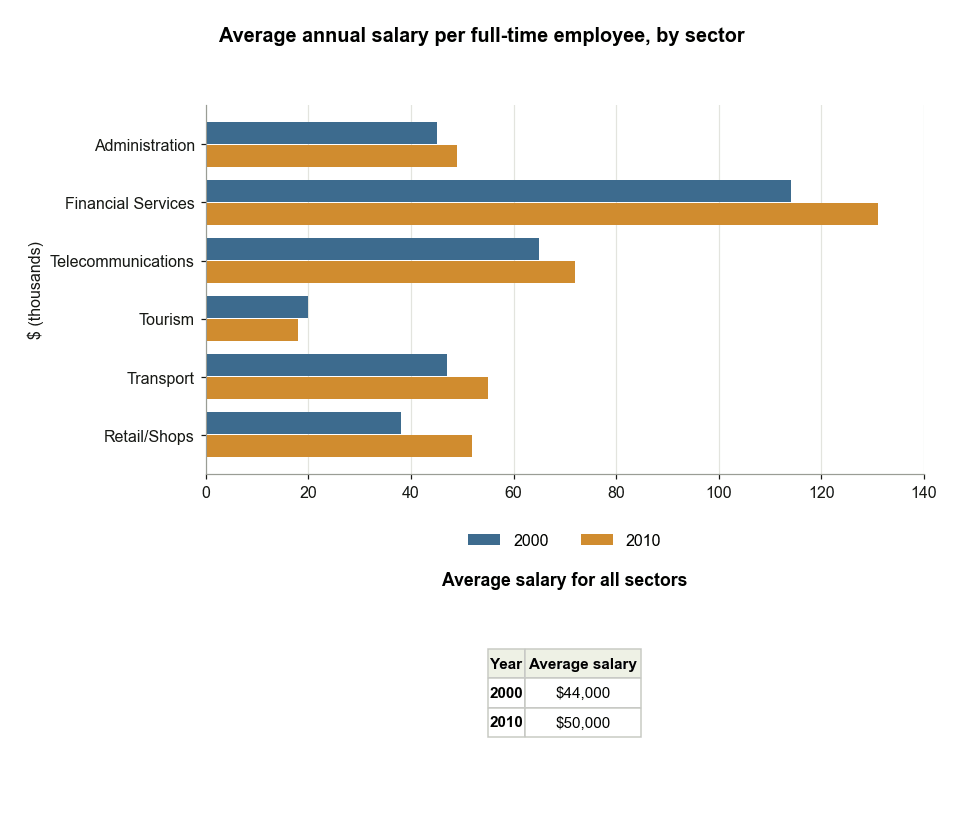
The chart below shows the average earnings of people in various areas of work in one country in 2000 and 2010. The table shows the average salary for all sectors in the same period.
下面的图表显示了2000年和2010年某国各工作领域人员的平均收入。表格显示了同一时期所有行业的平均工资。